Harmonic Distortion
The recipe. Distortion is addition: a pedal takes the note you play and adds new notes above it — its harmonics. Which harmonics, how loudly, and how that changes across the neck is the pedal’s sound. This chart is that recipe, measured.
Two words, two levels: the Fingerprint is a pedal’s full characterization — the whole suite of measurements made at one setting (this one, plus Transfer Curve, Compression, Gain Map, Chord IMD, and the Waveform Matrix). Harmonic Distortion — this chart — is one lens on it. In the library, a Fingerprint groups its sub-measurements under the pedal.
What it shows
Each curve is one harmonic — a note the pedal adds above the one you play. Hn = n × the note’s frequency; H1 is the note itself. (Not overtone numbering.) Read a curve at the note you play: the H3 value at A3 (220 Hz) is how loudly the pedal outputs that note’s third harmonic, at 660 Hz. Odd harmonics (aqua) sound gritty and edgy; even harmonics (orange) sound warm and octave-like. H1 is the pedal’s basic tone shaping — its EQ. “Relative to H1” re-reads everything against that EQ so you see the pure harmonic mix.
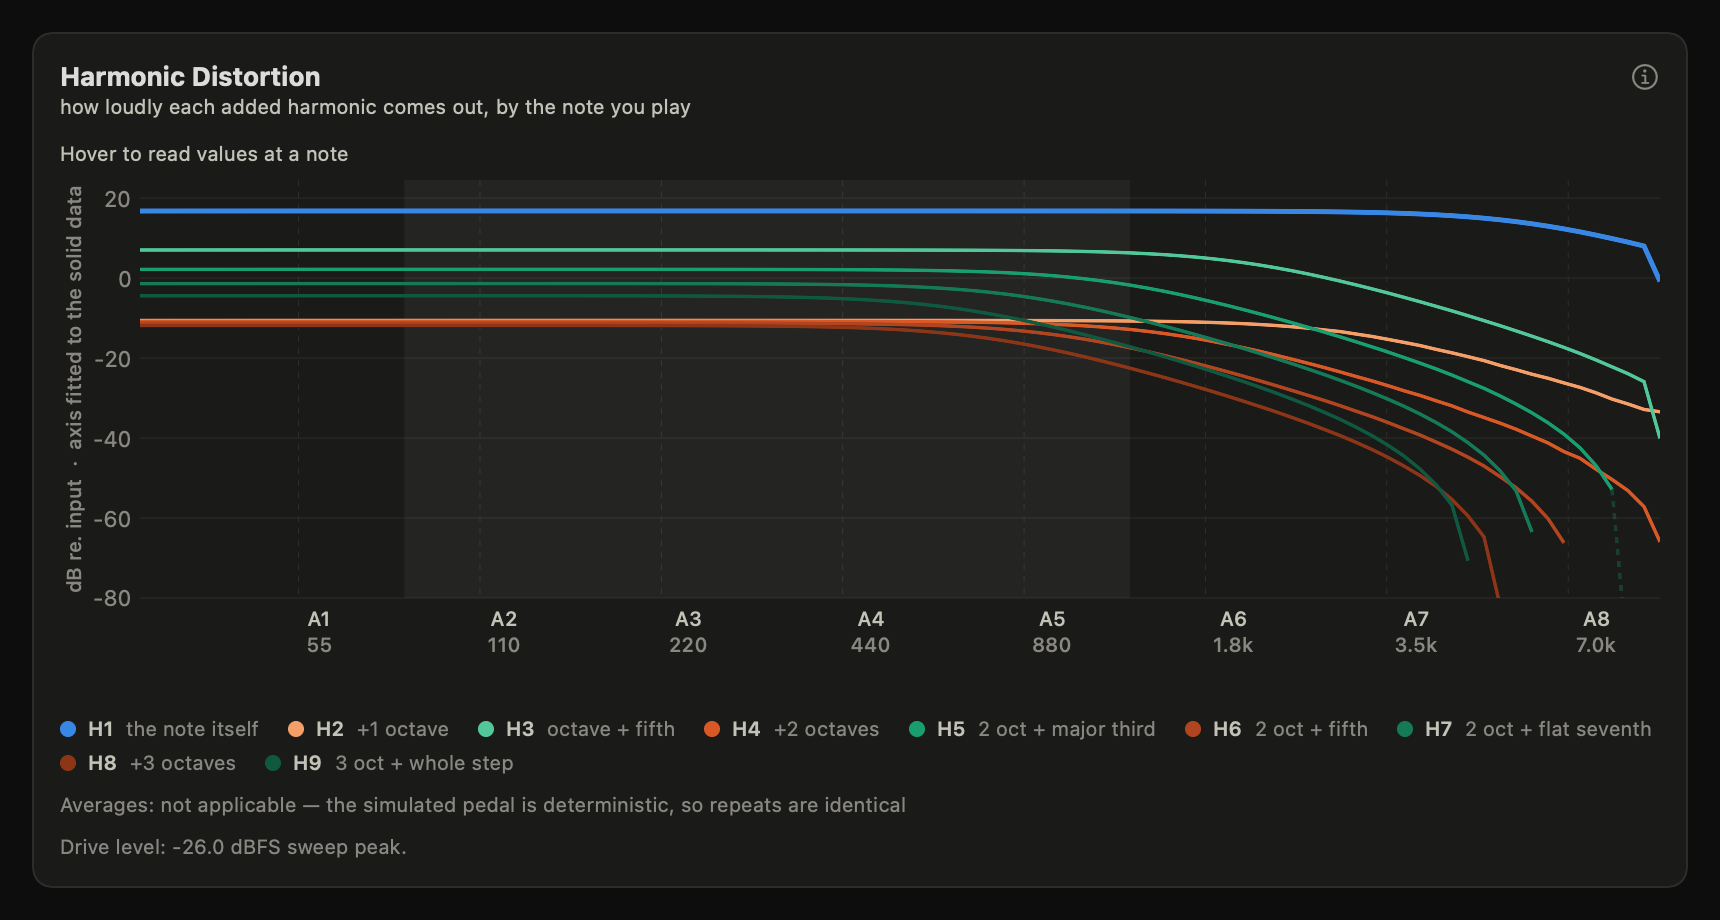
Harmonics are numbered by frequency multiple: Hn sits at n times the note’s frequency, so H1 is the note itself, H2 is one octave up, and so on. Even harmonics (H2, H4, …) arise from asymmetry; odd harmonics (H3, H5, …) from symmetric clipping. PedalScope does not use overtone numbering (which is offset by one: the “first overtone” is H2).
The legend spells out what each harmonic is musically: H2 is one octave up, H3 an octave and a fifth, H4 two octaves, H5 adds a major third — which is why the odd/even balance isn’t audio trivia but chord voicing.
How to read it
Hover to read exact values at any note; the shaded band marks guitar range.
The axis is yours to frame. Every frequency chart carries two small selectors (top right of the plot). Range windows the axis: Full is the whole measured band, Audio is 20 Hz–20 kHz, and Guitar is 70 Hz–8 kHz — low E with drop-tuning headroom, up to where guitar-speaker cabs have rolled off; where the instrument actually lives. Audio and Guitar are fixed frames — the axis shows exactly that band no matter what was measured, so every record is framed identically (a measurement that stops short of the band’s edge simply leaves that margin empty). Unit labels the ticks as note names (with Hz beneath) or as Hz alone. Both apply app-wide to every frequency chart and are remembered. The note names are nominal — A4 = 440 Hz, equal temperament, a standard-tuned six-string’s range — and a fretted note lands a few cents from them; see Tuning and temperament.
The vertical axis says how it is scaled. By default it is fitted to the solid traces — the shaped parts of the harmonics shown, inside the frequency window, plus a small margin — so a harmonic’s shape reads at full size; the dotted (at the floor) and dashed (past the band edge) data are still drawn, and run off the pane where they fall outside that fit. The fit follows the data, not the tick grid: the axis is exactly as tall as the solid data plus its margin, never stretched to a round number, and the tick marks are chosen inside it. Extend the vertical axis to include the dotted and dashed data (beside the Relative-to-H1 checkbox, remembered app-wide) spans this record’s full range instead — H1 at the top down to the deepest read — so the harmonics read against each other: a harmonic 60 dB down and one 20 dB down look as far apart as they are. The same checkbox sits on the Distortion-vs-Note chart below and on the Compare overlay; one setting, all three. Either way the axis label states which scaling you are looking at, on screen and in every export, and a trace that is noise never sets the fitted scale.
A dotted, faded stretch means “at the floor — noise, not a response”. Reading harmonic k means reading whatever landed in its analysis window, the rig’s and pedal’s own hiss included, and a symmetric clipper’s even harmonics are exactly that: a read of the noise. The app tests each read for coherence — a shaped response is a phasor whose phase advances smoothly with frequency; noise scatters — and draws a read that is noise dotted and faded, names the harmonic in the legend (“at the floor — noise, not a response”, or “partly at the floor” where it is a response at some notes and noise at others), and marks it (floor) on hover. It is the same test the Compare distance applies (see Comparing measurements). A dotted read is still drawn where it was read, but it is not the pedal, and no auto-scaling will ever make it fill the pane.
Grit vs. warmth at a glance: if the aqua (odd) family dominates, the clipping is symmetric — focused, classic hard-clip character. A strong orange (even) H2 means asymmetry — thicker, warmer, octave-tinged. Don’t take the chart’s word for it: in Simulation mode the asymmetry slider is that H2 — at zero the even stems sit on the floor, and every notch you add raises them out of it; the Hear-it panel plays the change.
Slope of the family matters. Harmonics that die off quickly with order (H7, H9 far below H3) sound smooth; a slowly decaying series reads as bright, fizzy, aggressive.
The falling right side of every curve is usually the pedal’s tone filter shaving harmonics off — the same filter that sets its treble character.
A faded, dashed tail means “past the reliable edge”, not “quiet”. Reading harmonic k at note f₀ means reading output frequency k·f₀, and for high harmonics of high notes that lands beyond the band the measurement chain can honestly report. The trace continues faded there so the geometry is visible, but the values are analysis artifacts, not the pedal — nothing downstream (fits, summaries, comparisons) uses them. Hover marks these readings with
*.
Distortion vs. note (the THD chart)
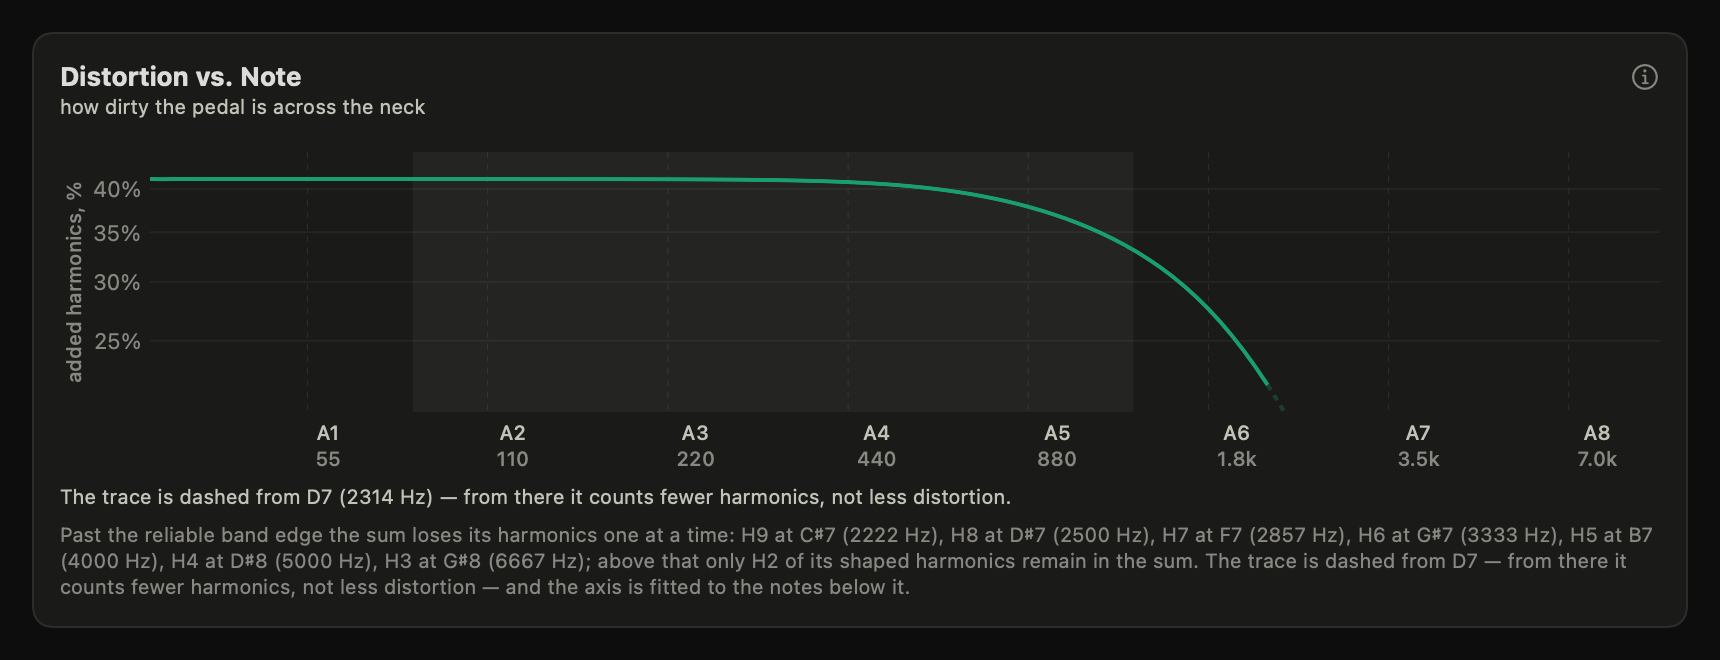
Total harmonic distortion: how much of the output is added harmonics rather than the note you played — around 1% on a lightly driven overdrive, tens of percent on a fuzz; a proportion, never a verdict on hearing. A falling curve toward high notes usually means a tone filter is shaving the harmonics off. The figure counts harmonics in the audible band (20 Hz–20 kHz) — what a rig could reproduce and an ear could hear — so the same pedal quotes the same THD at any capture rate. Toward the top of the neck the sum loses its harmonics one at a time (each leaves the reliable band at the band edge divided by its order), so the trace falls because it counts fewer harmonics, not because the pedal cleans up: from the first note where a harmonic the pedal actually shaped leaves, the trace is drawn faint and dashed, and a line under the chart names the note each harmonic left at (a harmonic that was already at the floor changes nothing when it leaves). The vertical axis is fitted to the complete notes the frequency window shows — the solid trace plus a small margin, never stretched to a round decade — so the dashed tail runs off the bottom of the pane where it falls below that fit: a line leaving the chart is the honest picture of a sum losing its harmonics, not a reason to stretch the axis. Extend the vertical axis to include the dotted and dashed data spans this record’s full range instead, tail included; the line under the chart says which you are looking at.
THD can legitimately exceed 100%: the ratio is added harmonics against the note itself, so a device that suppresses its own fundamental — a rectifier-style octave-up circuit is the classic case — outputs more new content than note, and the figure runs to thousands of percent. When that happens the chart’s axis extends upward in whole decades and a note under the chart says so; over 100% is octave-up behavior, not an error.
When there is no fundamental left
Suppression has a limit. Some devices — a ring modulator, a frequency doubler, an octave-up fuzz turned all the way up — return so little at the note you played that what comes back is no longer a measurement of the device but of the analyzer itself. PedalScope measures how far below the loudest harmonic a reading may sit before that happens (76 dB, from devices whose answers are known in advance), and where a record crosses that line it stops quoting anything that divides by the fundamental: distortion, the compression knee, the cleanup level, polarity, and the loop-memory verdict all go away, and the charts say why instead of drawing a number.
What stays is everything that does not need the fundamental: the harmonic levels themselves, the transfer-curve shape, the two-note behavior. That is the honest split — an octave-up pedal’s harmonic ladder is a real measurement, and its “distortion percentage” is not a number about the pedal.
A deep-but-real suppression is not affected. The reference rectifier in this project’s own Reference Box suppresses its fundamental by 44 dB and reads 16,422% THD, a figure predicted from resistor values to within 0.12% — well inside the line, quoted in full.
Hear it
Recipe resynthesis plays the chart: the fundamental plus the measured H2…H9 levels, rebuilt as pure tones. Solo the groups — full recipe, odd only, even plus fundamental, fundamental alone — and the bars become timbre: the odd family alone is the grit, the even family alone is the octave-flavored warmth, and the full recipe is the pedal’s steady-state color. Every variant is loudness-matched, so what changes is character, never volume. The footer states the toggle’s measured contrast for this record’s model — a number below the stated contrast floor (a bar on that measured metric, not a hearing threshold) means the comparison is subtle on this device, not a playback fault. Headphones or full-range monitors recommended — see Listening conditions.
▶ Drag the asymmetry slider yourself — watch H2, then hear it
Common misreadings
One Harmonic Distortion measurement is one drive level. “This pedal has more H2 than that one” is only meaningful at matched levels — loudness bias is real in measurements too. The caption under the chart states the drive the sweep was captured at — in dBFS, and in millivolts at the pedal input when the record’s own calibration carries a metered volts factor — and appends the PSC-1 condition when the record meets it; read it before comparing two records, and never borrow the drive from the Transfer Curve card beside it, which is a separate control. The Gain Map makes level a full axis.
H1 isn’t distortion. It’s the pedal’s linear tone shaping (EQ). A mid-hump in H1 colors the sound even at clean settings — toggle “Relative to H1” to separate EQ from harmonic content.
Harmonics above the pedal’s tone filter aren’t “missing” — they’re filtered. Read the fingerprint together with H1 before crediting a circuit with politeness its output cap is providing.
Averages
The measure sheet’s Averages (Harmonic Distortion only) control plays the sweep 1, 2, 4 or 8 times back-to-back inside one capture and combines the repeats coherently. The label carries its scope because the control also sits on the Full Fingerprint panel, beside suite-wide costs: the other measurements in a suite — Transfer Curve, Compression, Gain Map, Chord IMD, Waveform Matrix — are single captures at their standard plans, so their floors are not averaged and this setting does not change their run time. The quiet even harmonics are where it shows: they are the most noise-limited reads this app makes, and a read that today reports only an upper bound may resolve into a real figure at a deeper setting.
What it costs and what it buys, honestly stated:
Cost is one extra sweep (plus a half-second gap) per repeat — the chart’s caption quotes the record’s time factor against the default.
Buy is up to 3 dB of harmonic signal-to-noise per doubling. That is the coherent-combination ceiling, not a promise: real rig noise is partly correlated (mains and its harmonics, converter idle tones, thermal drift), and what averaging actually delivers on a given rig is a measured property — established on a loop-only null run — never a computed one.
The default is 4 sweeps. On the reference rig’s own null-run measurement each doubling delivered close to its full 3 dB ceiling, so four sweeps buy roughly 6 dB of even-harmonic resolution for about 30 extra seconds on a Harmonic Distortion run (a full-suite measurement grows by roughly a third). That figure was measured on one rig and is a property of rigs, not of the app — a noisier or cleaner loop delivers differently, which is exactly why the caption calls the factor a nominal ceiling. Drop the control back to 1 sweep any time speed matters more than the quiet even orders; the choice is sticky.
The measurement floor the app reads a record against follows its sweep count too: inside the reliable band an averaged record’s floor sits 10·log₁₀ N below the calibration’s single-sweep stamp (6 dB at four sweeps, 9 dB at eight), so Compare’s floor clamp sees what averaging bought instead of clamping an averaged record to a single-sweep floor. Outside the band — the deconvolver’s own residue below the fade-in edge, the fade-out artifacts past each harmonic’s top — the read is not noise and averaging buys nothing, so the floor stays where the stamp put it.
The measure sheet states both halves of the wait. A projected duration sits beside the control (≈ 48 s at the default on a hardware rig — the same estimate the full-suite warning uses, so the two can never disagree; a plugin or simulated source renders offline and shows no wall-clock figure), and while the capture sounds a Sweep k of N counter says which repeat should be playing. The repeats run back-to-back inside one capture, so the counter is derived from the plan’s own timeline rather than observed — and it deliberately stops at the last sweep if a capture ever overruns its planned duration: a counter that kept counting past the end would be reassurance about a capture that is no longer happening.
Every record stores the number of sweeps it averaged, and the caption under the chart states it along with two factors computed against the current default: the nominal SNR ceiling and the acquisition-time ratio. A record made before the field existed reads “inferred” — the app only ever made a single pass back then, so one sweep is derived from that fact, not measured, and it stays one sweep no matter where the default moves.
One consequence for comparisons: records measured at different averages have different resolution limits, so Compare flags such a pair rather than silently scoring it — the same footing as any other analysis-parameter mismatch.
Simulated records are the one place none of this applies. The simulated pedal is computed, not captured — there is no capture noise, and a repeat would return identical numbers — so a simulated record’s caption reads “not applicable” instead of the factors, and Compare never flags a simulated side’s averaging against a real record’s. That is a property of simulation, not a limitation of the record; every other parameter check (sweep range, length, sample rate, analyzer depth) still applies across a simulated/real pair.
For the curious
The measurement is Farina’s synchronized swept-sine method with Novák’s
phase synchronization: an exponential sweep makes each harmonic of the
sweep arrive as a time-shifted copy in the deconvolved response, so one
sweep separates H1…H9 cleanly. Each H_k(f) is normalized by input
amplitude and read on the output frequency axis (the k-th harmonic of
fundamental f₀ is read at k·f₀); a unit-gain wire measures H1 = 1. With
Averages above 1 each repeat is analyzed separately, a single inter-repeat
delay is fitted across all orders’ complex spectra, each repeat is
derotated by it, and the spectra are averaged in the complex domain —
never as magnitudes (averaging a biased magnitude only makes the bias
more precise), and never as raw waveforms (sub-sample drift between
repeats would comb the high harmonics downward while looking exactly like
a politer pedal). THD is
√(Σ|H_k|²)/|H1| for k ≥ 2, integrating the audible band (20 Hz–20 kHz)
regardless of capture rate. The interface’s own response and floor are
measured in calibration and divided out.
Two distinct limits bound every read, and the app keeps them separate. Validity: a read at k·f₀ is trustworthy only up to the band the chain was calibrated over (division by the loopback response is meaningless past the calibration sweep’s own edge) and below the point where the capture’s alias image of the next harmonic order collides with it, at f₀ = fs/(2k+1) — both derived per record from the recorded sweep and calibration parameters. Beyond that bound traces fade and every downstream consumer excludes the points. Policy: among trustworthy reads, musician-facing figures count only the audible band — ultrasonic harmonics are real, and the full captured band still feeds the Hear-it model, but they aren’t sound a rig delivers, so they don’t shift the quoted numbers.
Try it on a record: open a Harmonic Distortion measurement, or watch the recipe move while you turn knobs in Live mode.