PedalScope
Distortion, decoded.
Every drive pedal shapes your signal in ways you can hear but can't quite name. PedalScope measures what the circuit actually does — and turns it into charts you can read, sounds you can compare, and words that make sense.
Coming soon to the Mac App StoreFree to download; measuring your own hardware and plugins is a one-time in-app unlock · For Apple silicon Macs, macOS 26 and later · Requires an audio interface for hardware measurement · plugins and Simulation Mode need none
Want a note when it launches? Email notify@pedalscope.com
Validated
against known answers.
One circuit in the hardware reference box must, by Fourier theory,
produce a harmonic ratio of exactly −13.98 dB. PedalScope measures
−14.0.
Plug in. Click once. Meet your pedal.
- 1 — Loop it in. Interface output → pedal → interface input. Any USB audio interface works.
- 2 — Measure. One click captures a complete Fingerprint — every analysis PedalScope offers, in a single pass: the Transfer Curve, the Harmonic Distortion recipe, a Waveform Matrix across notes and levels, and more.
- 3 — Understand. See the clipping shape of a pedal you've played for years. Play the harmonics by themselves. Read a plain-language summary built strictly from the measurements.
The clipping shape, drawn from measurement.
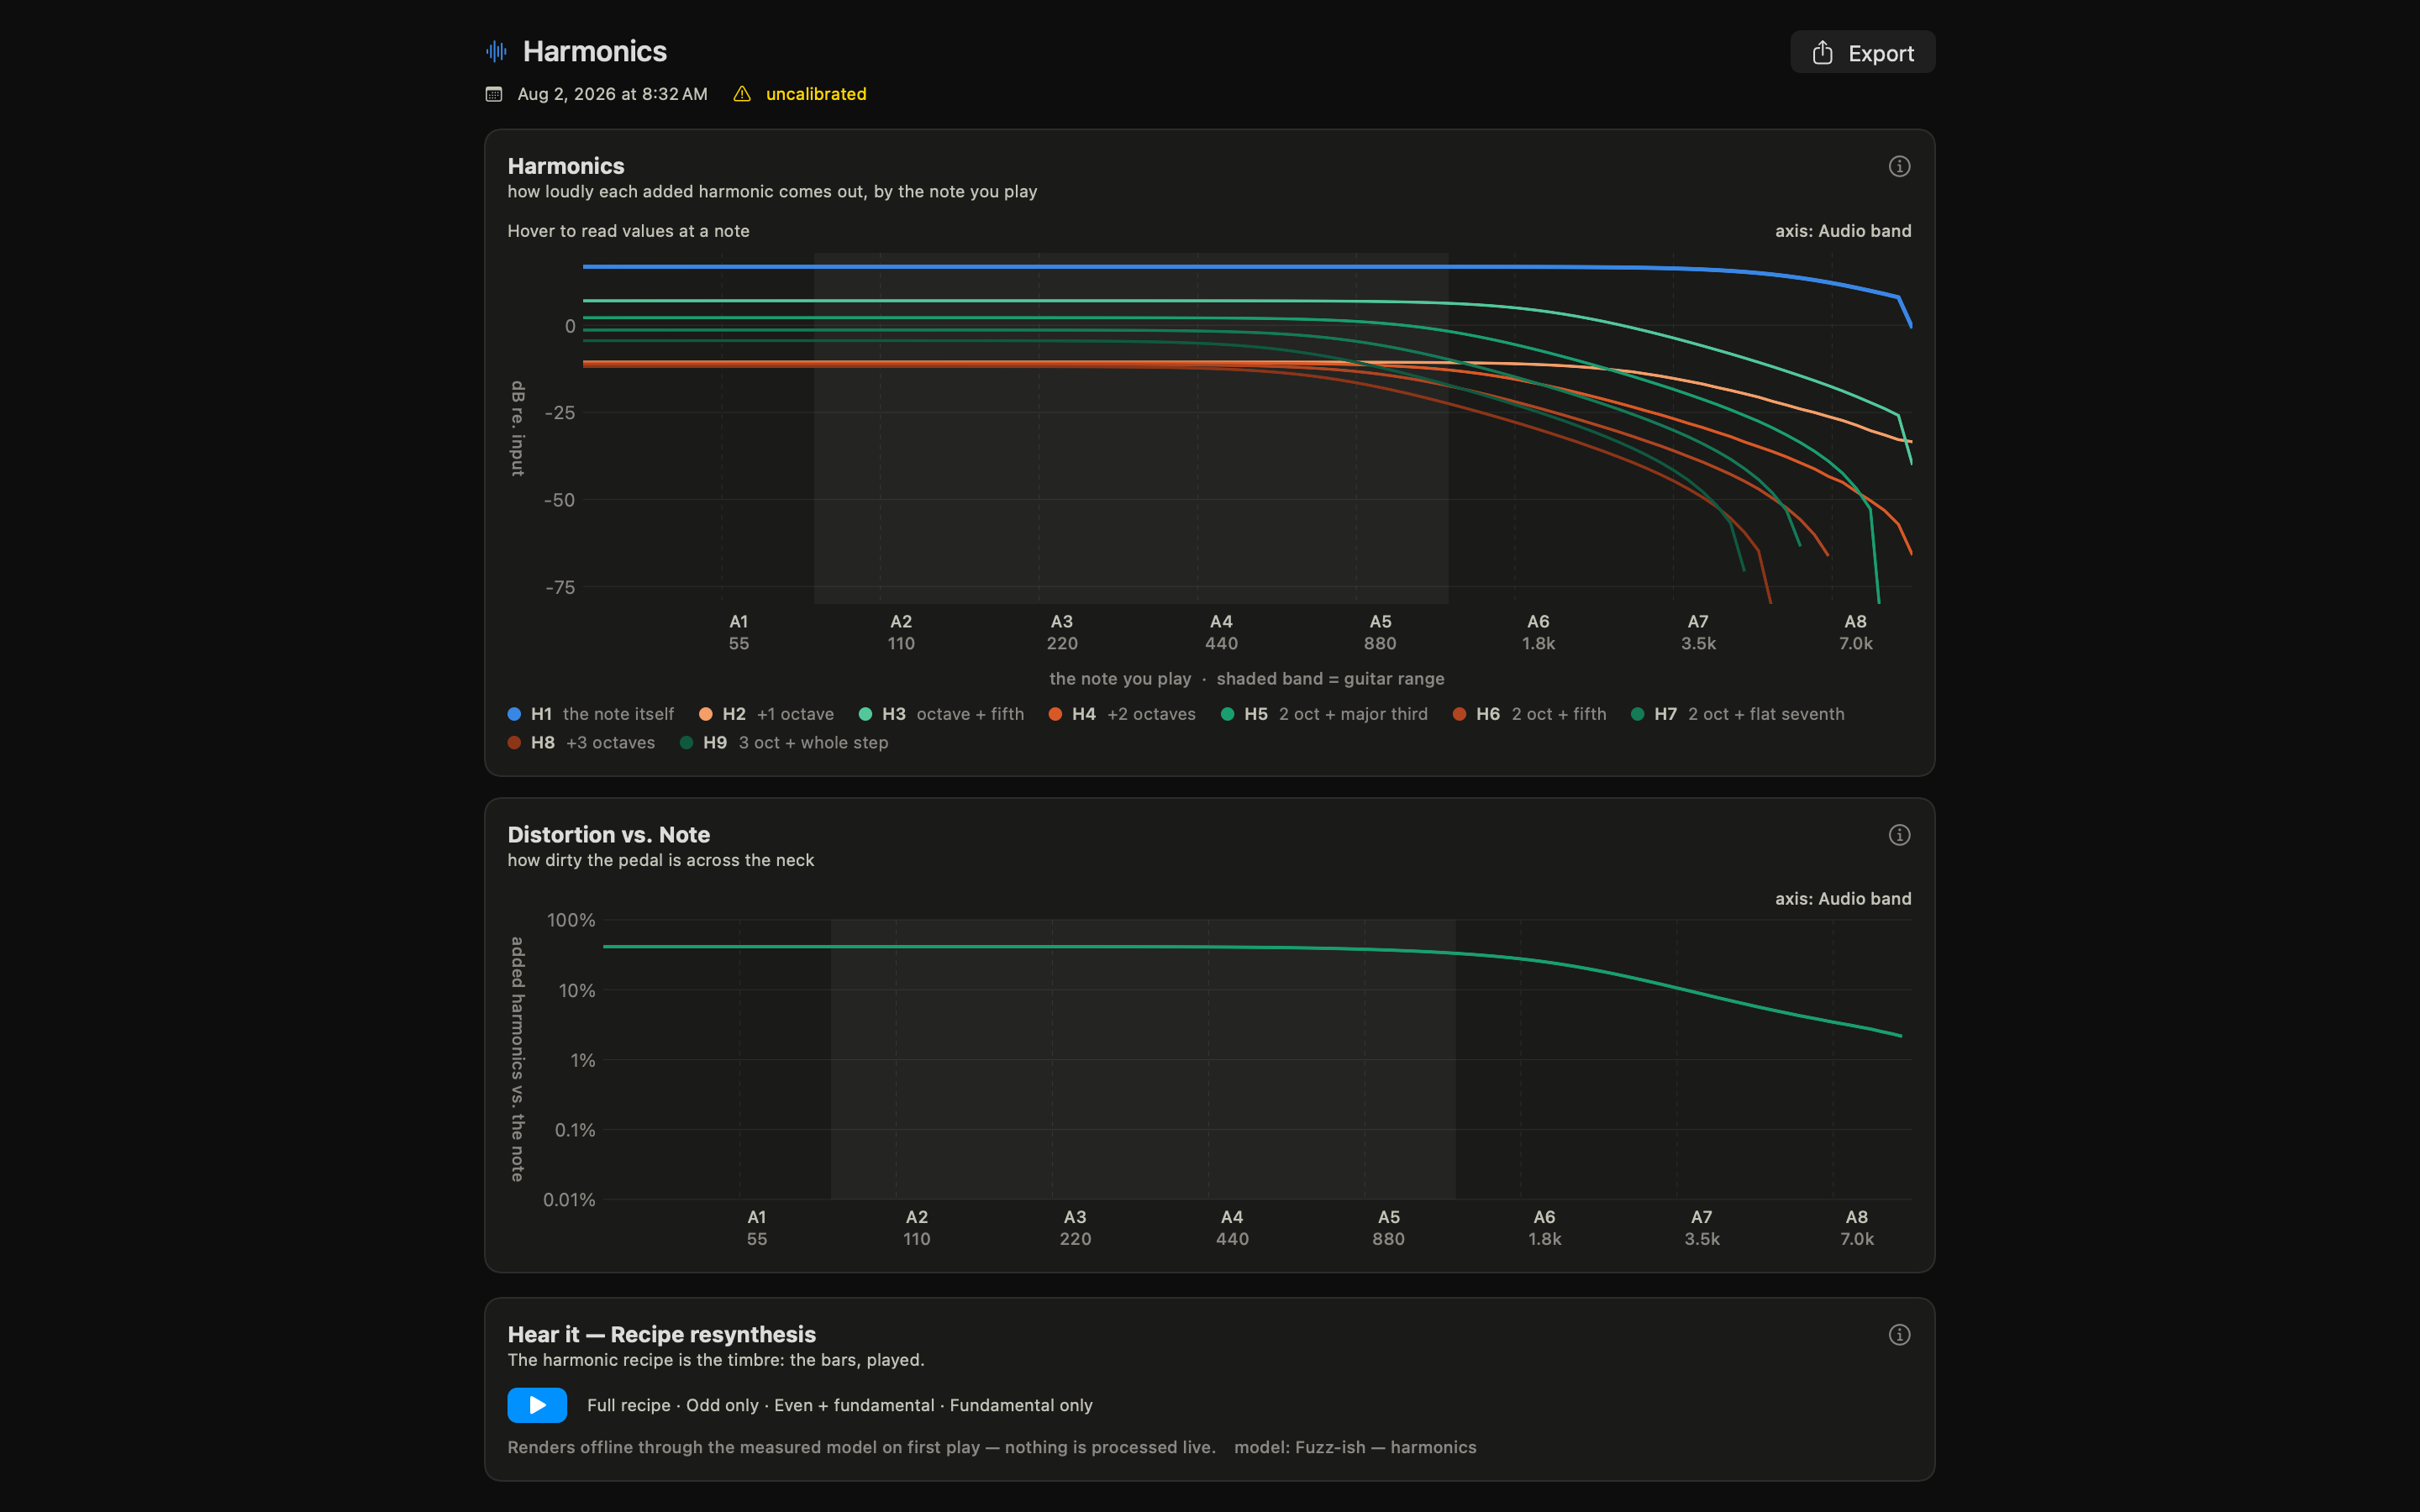
Transfer curves with real hysteresis. Harmonic recipes with even and odd orders separated. Distortion mapped across frequency and level, so you can watch a pedal clean up as you play softer. This is what "warm," "aggressive," and "touch-sensitive" look like.
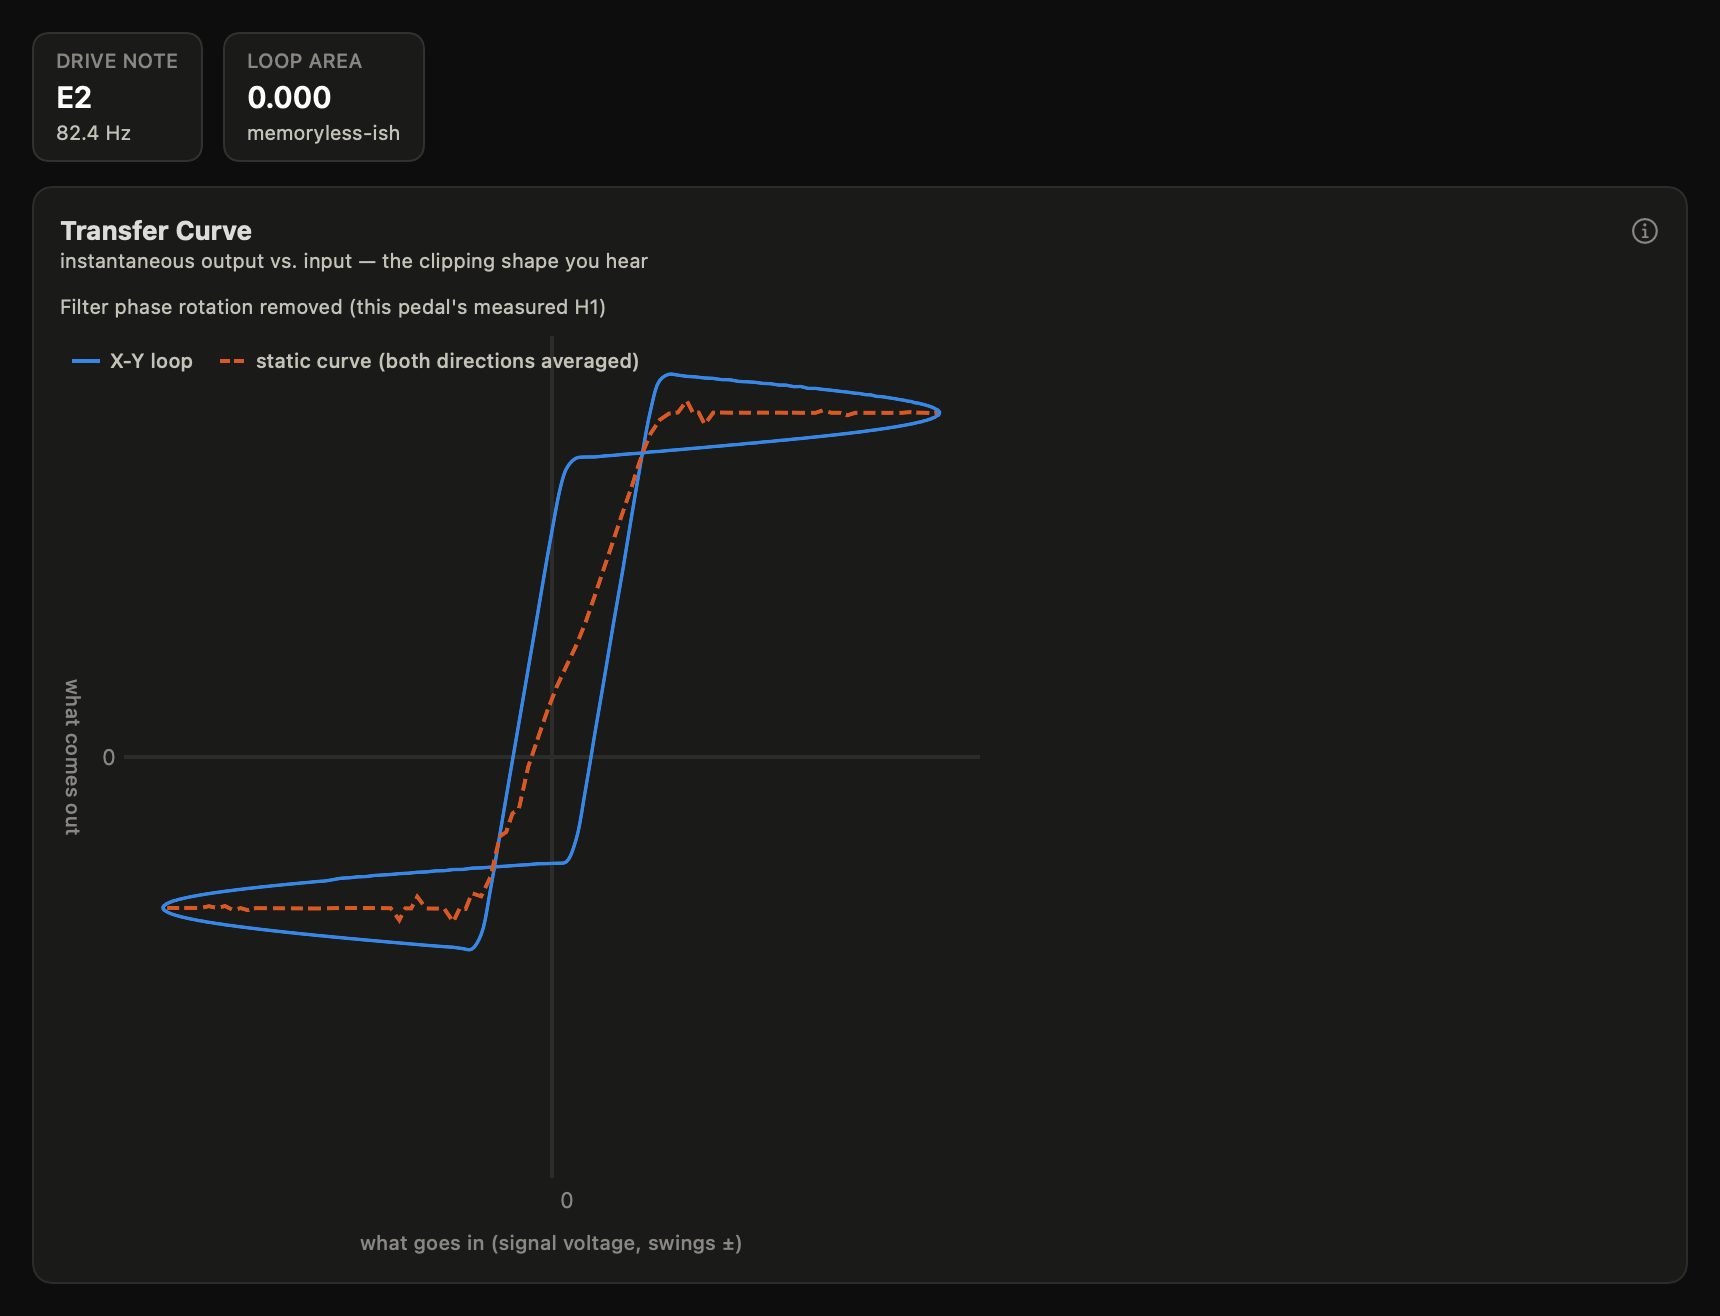
The transfer curve is the pedal's clipping shape drawn directly — steep where it's clean, flat where the clipper takes over, asymmetric where the warmth comes from.
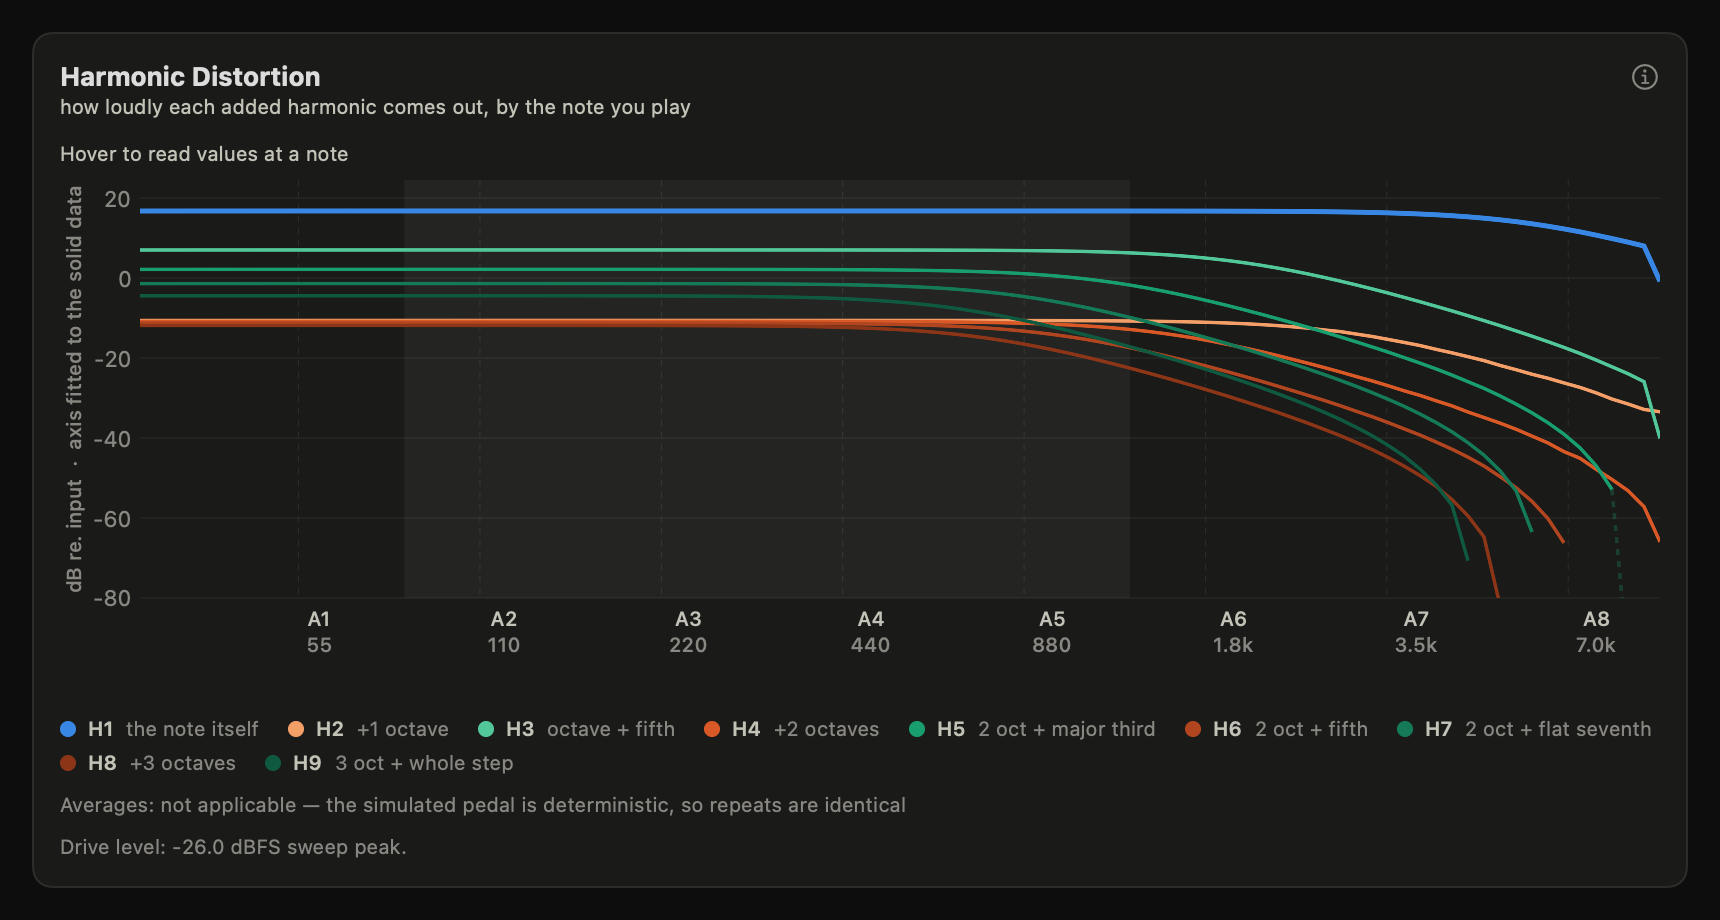
The harmonic recipe, even and odd families separated — the difference between thick and sour, made visible.
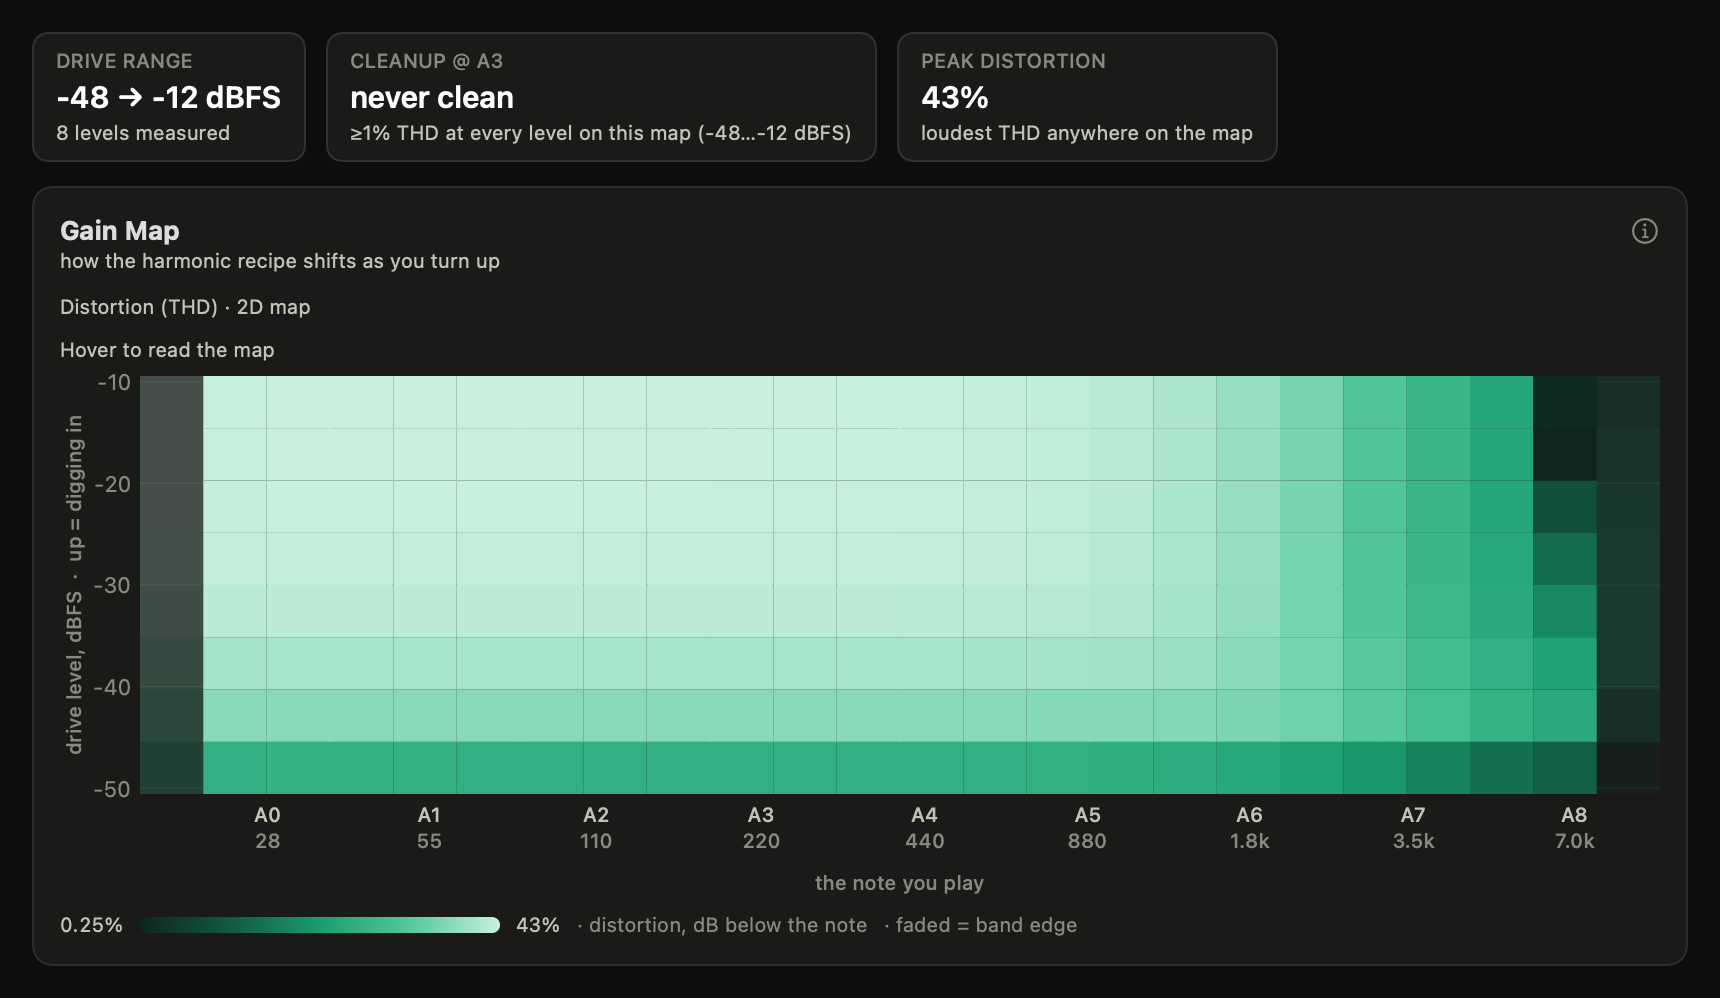
Distortion mapped across every note and drive level — watch where a pedal cleans up, and where it never does.
Loudness-matched, so nothing wins by being louder.
Every comparison in PedalScope is matched to equal loudness — the trick your ears fall for is the first thing the app controls for. Solo the even harmonics. Listen to the intermodulation "mush" of a distorted chord by itself. A/B two pedals blind and find out what you actually prefer.
Listen for: The first seconds are nearly clean; from the middle onward the note grows hair as it pushes into the curve's bends — that arrival of grit, not a volume change, is what the ramp teaches.
Listen for: Under the two notes there's a rough, beating undergrowth that neither note explains — that's the intermodulation, isolated in the next player.
Listen for: Only the undergrowth remains: a dissonant, clattering chord of tones the pedal invented. Through a clean bypass this lane is near-silence — the products are made by the distortion, not the notes.
Made for people who own a soldering iron.
Define your pedal's controls, sweep a clipping-diode switch position by position, and overlay the results — mods become measurements, and measurements become figures you can post. Export everything as open JSON your Python scripts can read.
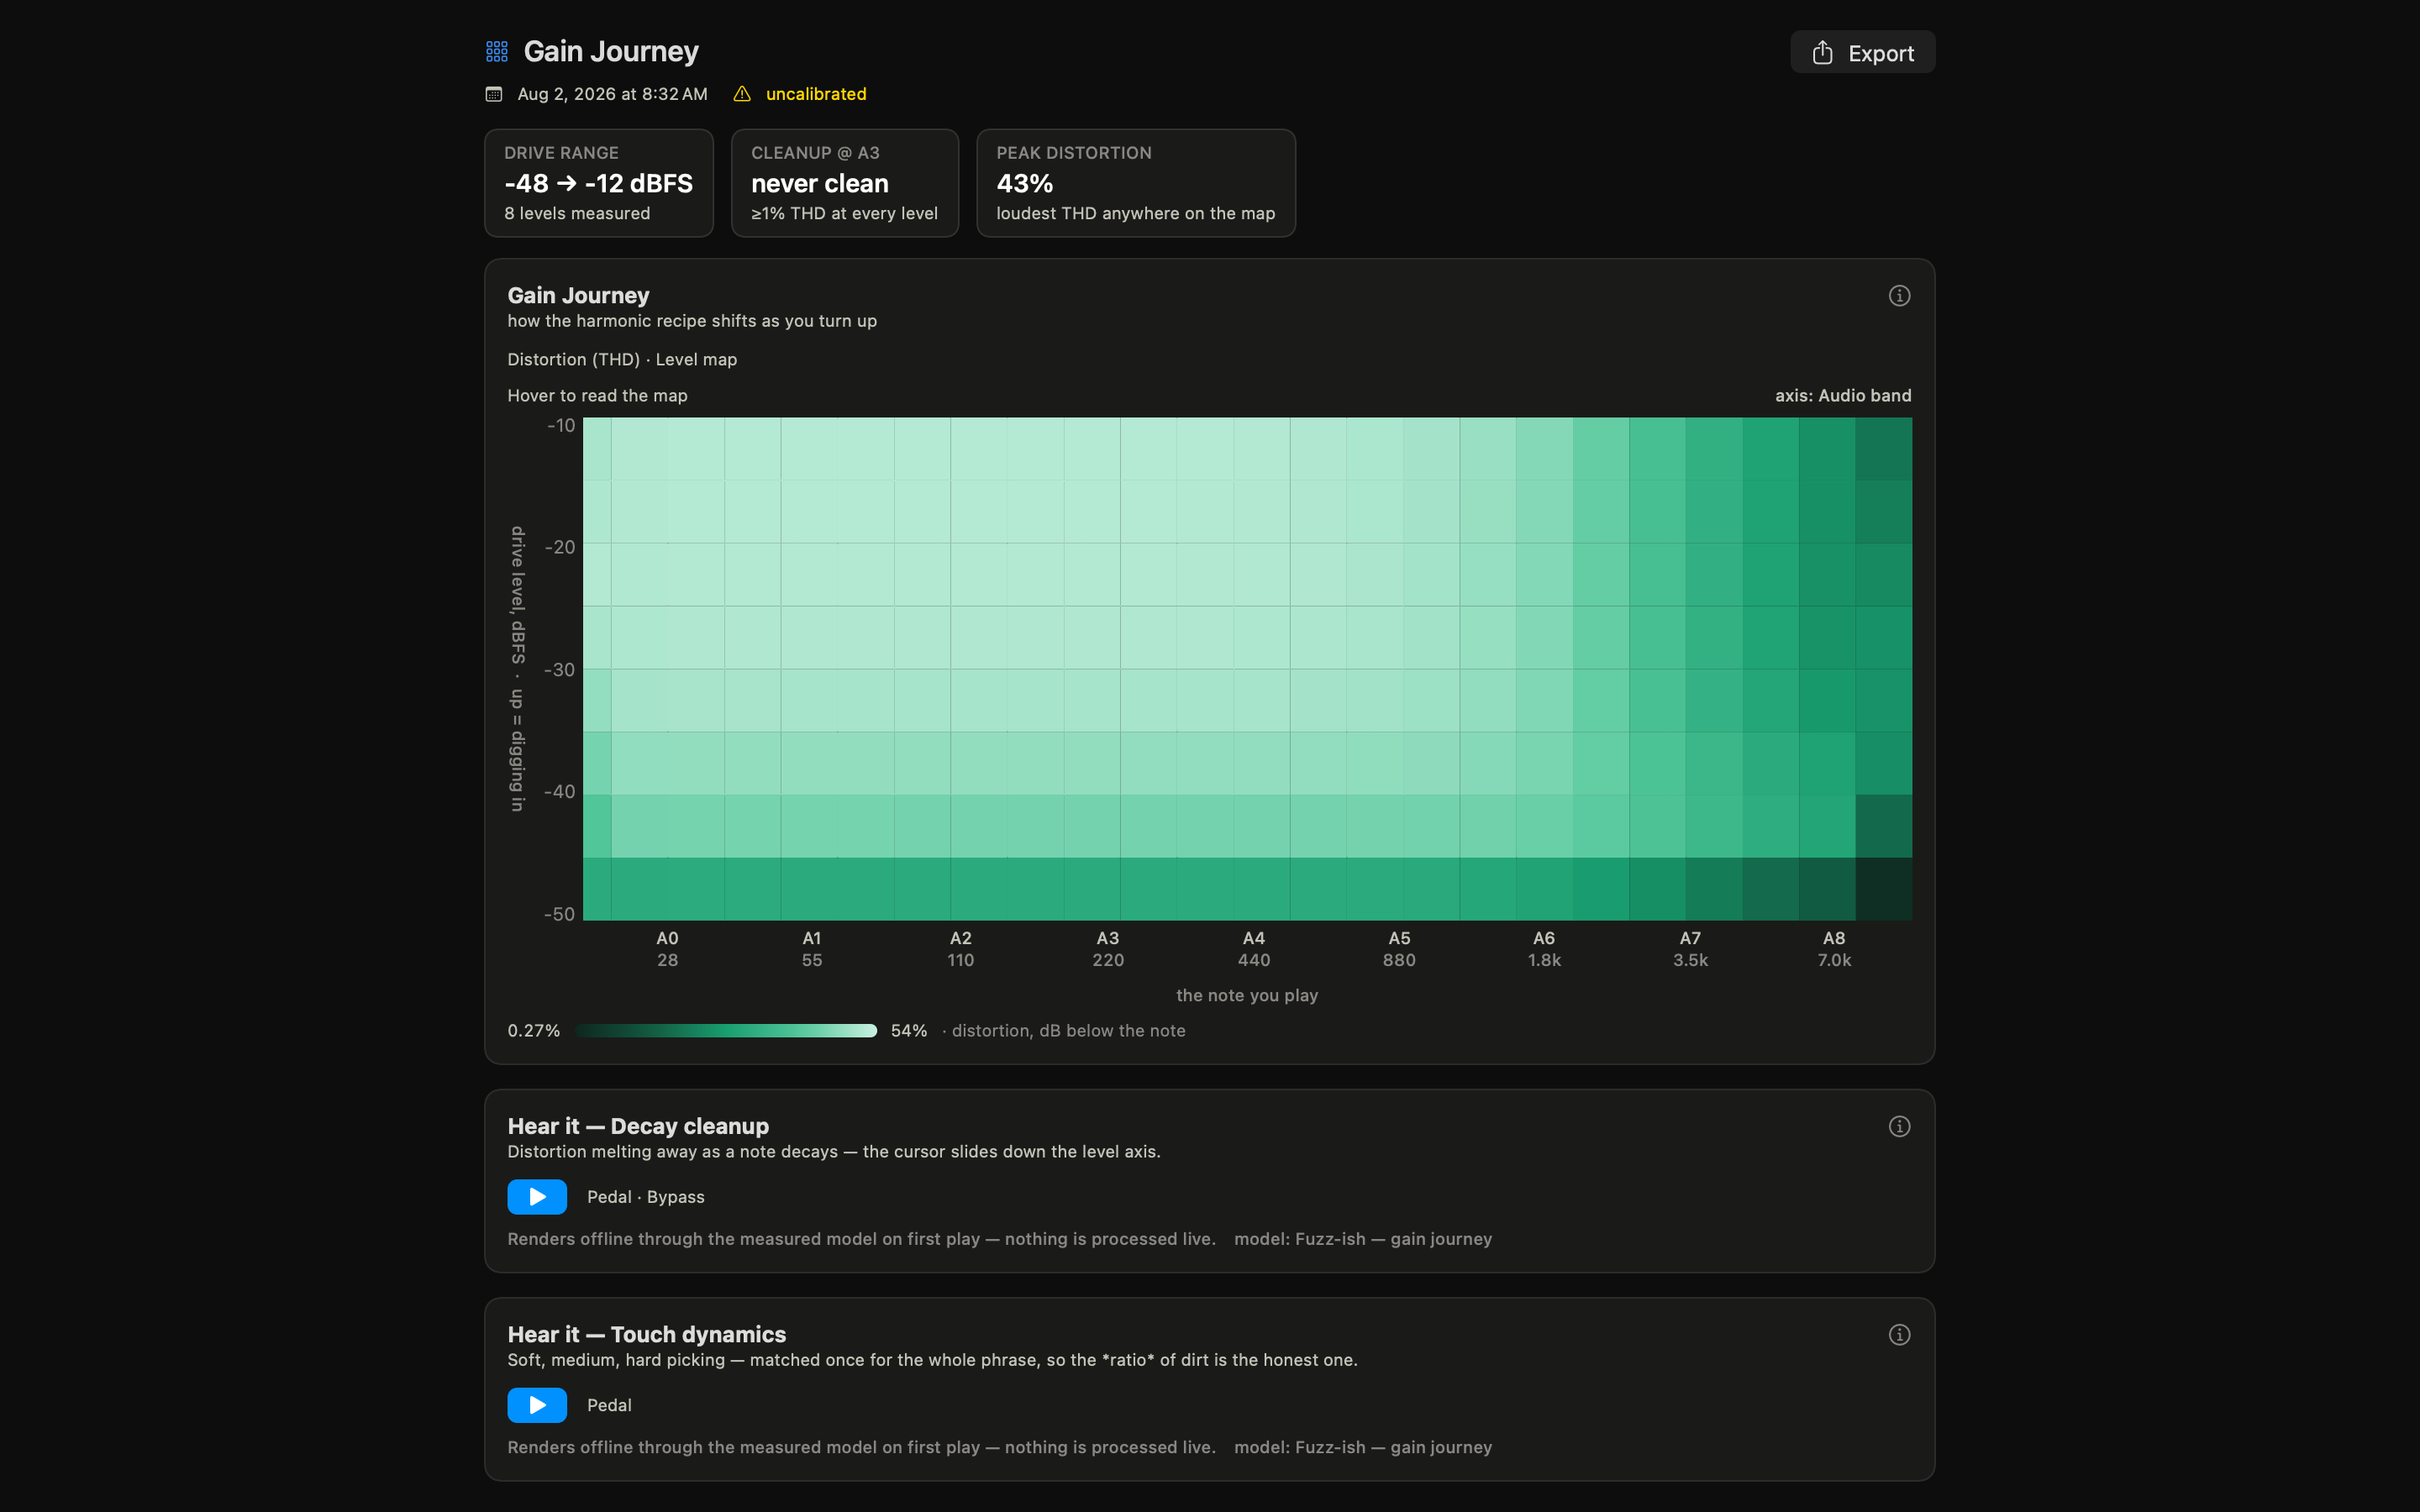
Plugins are pedals here, too.
Point PedalScope at an Audio Unit — a drive plugin or an amp sim — and it gets the same treatment as hardware: same sweeps, same charts, same library. Set the plugin in its own window, measure, and Compare the result against the pedals it sits beside. Software finally answers two questions directly: did that update change the sound? — every measurement records the plugin's exact version — and does the model measure like the hardware it's based on? Measure the same setting at two sample rates and Compare: a properly oversampled plugin reads the same at both, and one that aliases doesn't. How plugin measurement works →
No pedal handy? Start in Simulation Mode.
Design a virtual drive circuit — threshold, symmetry, knee, filters — and measure it with the same tools. It's the fastest way to learn what every design choice does to your tone, and it works on a MacBook on the couch. See how it works →
How we know it's right.
Published methods (Farina / Novák synchronized swept-sine), validated against analytic ground truth in software and reference circuits in hardware. Built by a neuroscience researcher whose career has been spent quantifying complex signals and designing visualization software — and who builds amps and pedals in his spare time. The full methods and credits are in the guide, and the methods themselves are published as two open documents — a technical reference and a plain-language companion — built from the same code the app runs.
Why the number matters to a musician.
The guide says what a chart means. The Reading Room says why it matters to the way a chord sounds in a room — the hearing and the physics between a figure on a record and what reaches your ears, one question per page. Start reading →
Private by construction.
Your measurements stay on your Mac. No account. No tracking. No analytics — not even on this website. The plain-language summaries generated from your measurements run entirely on-device and are always labeled. The whole privacy policy fits in a paragraph →