Chord Roughness (Chord IMD)
Why chords get mushy. Distorting one note adds harmonics — octaves and fifths above it, still musical. Distorting two notes does something uglier: the nonlinearity multiplies them together, inventing tones at sums and differences of their frequencies. Those intermodulation (IM) products mostly land outside the key, and they — not the harmonics — are the mush, growl, and fizz of a distorted chord. No single-note measurement can show this; this one plays intervals on purpose.
What it shows
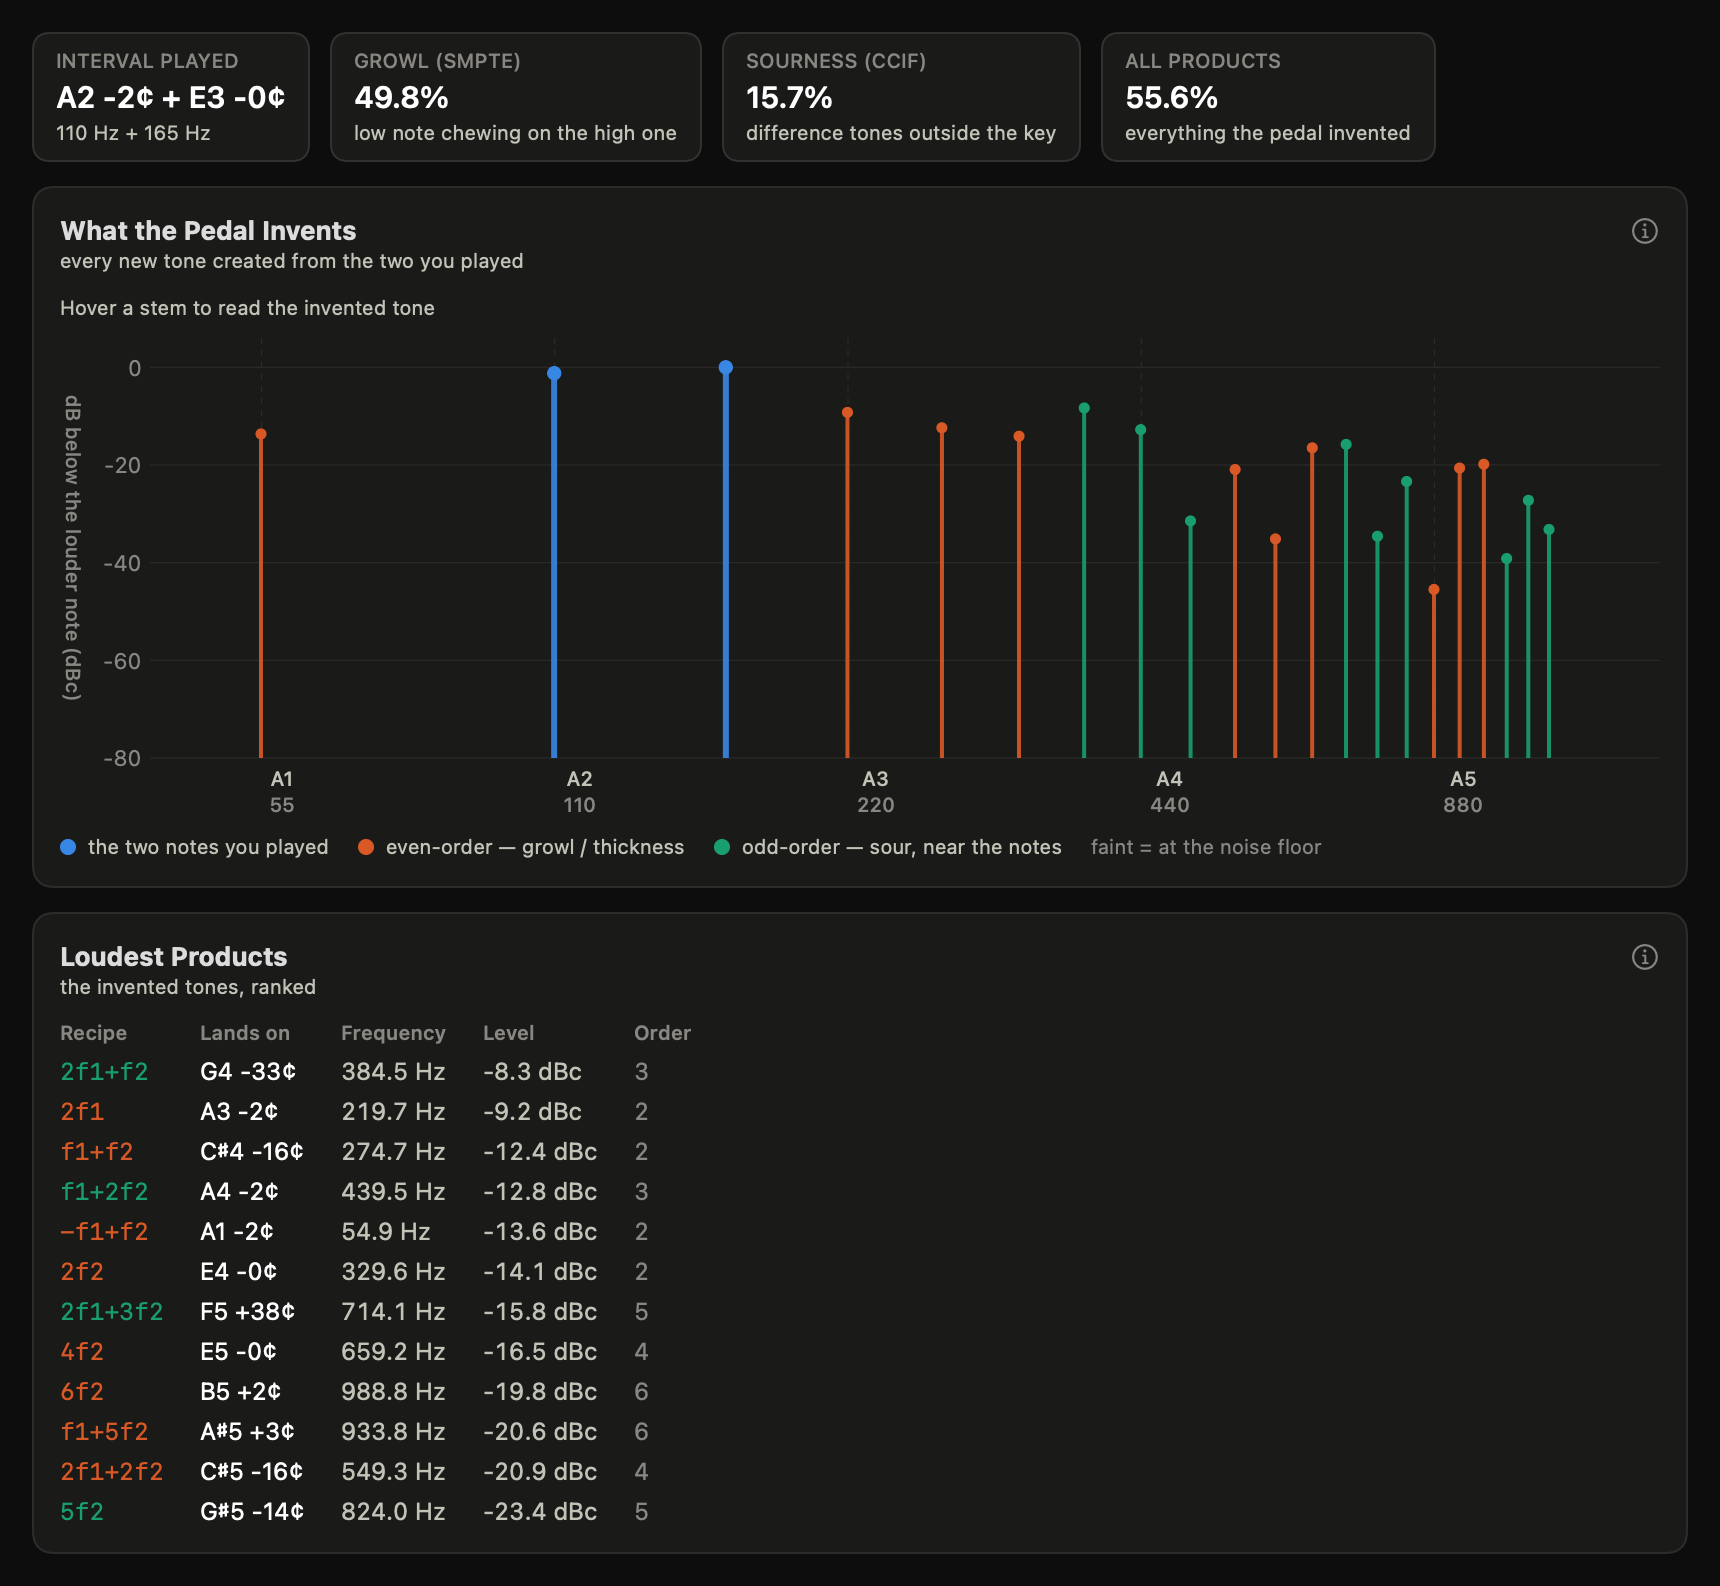
Distorting one note adds harmonics — octaves and fifths, still musical. Distorting two notes also multiplies them together, creating sum and difference tones (f2−f1, 2f1−f2, …) that may or may not land in the key. The blue stems are the notes you played; everything else is invented. Orange stems are even-order products and aqua stems odd-order — the colour says which power of the nonlinearity made a tone, not what it does to the chord. On a wide interval like a fifth, order and position come apart: the four products nearest the played notes are all even-order. What a product does to the chord is its harmonic role, and that is what the tiles above the chart sort by. The louder and less pitch-aligned a stem, the uglier the interval sounds — this is why high-gain players move to power chords.
The tiles: what each invented tone does to the chord
The five tiles beside the interval sort every invented tone by its harmonic role — where it lands on the harmonic grid of the interval you asked for — and state each role’s summed level in dBc, decibels below the louder of the two notes, the same scale as the ranked table. Thickening is energy on the pitch classes of the two notes you played, at or above the low note: it reinforces the chord. Growl (sub-octave) is energy on those same classes below the low note — octave-down weight under the chord. Added colour is energy on a consonant pitch that is not a chord tone — a third, a ninth, a sixth — the notes a pedal adds that still sound like music. Sourness (clash) is everything else: dissonant classes, and any tone further than 20 cents from every fret. All products is the total — how much, not what kind. Hover a tile to see the recipes it sums, each with the pitch it lands on and its own level; the tile’s figure is the power sum of exactly that list. A tile reads “≥” when a recipe in its role could not be read on this record’s lattice, so the figure is a lower bound on the role’s true energy; “none” when nothing in the role stands above the capture’s floor.
The roles are assigned at the interval you asked for, and measured at the analysis lattice — the line under the tiles says so for each record. Every product’s recipe (2f1−f2, say) is placed at the frequency it would have if the two notes were exactly the interval requested. For a fifth that interval is 3 : 2, and every recipe then lands on a grid of 55 Hz steps whose points are not interchangeable: steps 1, 2, 4, 8 are A1, A2, A3, A4 (root and octaves), 3, 6, 12 are E3, E4, E5 (the fifth), 5 and 10 are C♯4 and C♯5 (a major third), 9 is B4 (a ninth), 7 is G4 31 cents flat (the seventh harmonic), 11 and 13 are D♯5 and F5 nearly a quarter-tone off. The level is then read from the analysis bin the product actually landed on. The two are kept apart on purpose: to keep products separable the notes are snapped a few cents onto the analysis lattice (the interval tile shows the offsets), so a classifier that read the lattice’s own frequencies would call f2−f1 at 54.38 Hz “20 cents flat of A1” when it is the exact octave-down chord tone the lattice displaced. The lattice is the instrument; the interval is the music. The grid is computed from the requested notes, never tabled: a major third (A2 + C♯3) reads as 5 : 4 on a 27.5 Hz grid, where the fifth becomes added colour and the roles recompute.
A role beats a recipe. On the project’s reference clippers the loudest product on both the symmetric stage (P3) and the asymmetric one (P4) is the octave below the root — but from different recipes, third-order 2f1−f2 on P3 and second-order f2−f1 on P4 — and the two circuits, which the old tiles could not tell apart, separate cleanly by role. On the 2026-09-04 records: P3 reads Thickening −65.2 dBc over Growl −68.4, with Sourness −68.5 (its 2f1+f2 lands on the flat seventh) and Added colour −76.8; P4 reads Growl −75.3 over Thickening −76.2, Added colour −76.2 (its f1+f2 lands on the major third) and Sourness −81.6. The symmetric clipper thickens the chord and adds a seventh; the asymmetric one adds weight under it and a third. (That P4 capture read about 9 dB low across the board — its coherence check, under the table, is over the bar — and the same shape holds on the two earlier captures of the same positions.)
The line under the tiles also states what the record enumerated — “54 recipes, orders 2–7” on every standard capture — so a tone absent from the list can be told from one that was measured and silent: the analyzer walks every sum, difference and harmonic of the two notes up to seventh order, and nothing else. (Records measured on the original exact 3 : 2 probe hold 19: on that lattice several recipes shared a bin, and one bin keeps one recipe.) That census is a small-signal choice; the reasons are on How Chord IMD is analyzed.
The tiles before 5 September 2026. Earlier builds showed three percentages — Growl (SMPTE), Sourness (CCIF), All products — borrowed from two laboratory two-tone standards whose recipe lists cut across the roles above (Sourness summed one second-order and two third-order recipes, so a circuit change that traded one for the other left it nearly unchanged), and printed them to one decimal place, which rendered every reference clipper’s 0.02–0.06 % as “0.0 %” or “0.1 %”. The arithmetic was honest: the session that replaced them reproduced record 447’s stored Growl of 0.0243 % by hand from its eight SMPTE recipes (a summed −72.3 dB below the high note, consistent with its loudest product at −76.4 dBc). The “2.43 %” that appeared in the bench notes for the same record was those figures transcribed a hundred times too large; nothing on any record was ever wrong. Records keep their stored percentages; only the tiles changed.
The spectrum sits on a musical pitch axis: every invented tone is placed at the note it lands on, labeled with its deviation in cents from the nearest real pitch (A4 = 440 Hz, equal temperament — note names are nominal, and the interval tile’s own cents offsets are explained on Tuning and temperament). The axis window and tick unit follow the app-wide Range and Unit selectors — see Harmonic Distortion. How the products are found and read — coherent sampling on a rectangular window, the analysis lattice, the two floors and the coherence check — is one concept page: How Chord IMD is analyzed. This page is about reading the chart.
How hard the pedal was driven
The line under the tiles states the drive level, read from the stimulus
stored in the record: the combined peak of the two notes (what a clipping
pedal’s knee is compared against) and each note’s own level (what the
two-tone physics is written in), with a note that the two tones are equal —
every order relation in the analysis assumes it. On the standard probe that
reads −26.0 dBFS combined, two tones at −32.0 dBFS each. When the record’s
calibration measured the interface’s volts factor the same line quotes the
level in volts at the pedal input; a plugin record, or a rig calibrated
without a factor, states dBFS alone, which is still the whole level — no
voltage is ever invented. Two Chord IMD records are comparable only at the
same drive: for a clipping pedal the drive is the dominant variable, and
two records with the same title and the same tiles invite a comparison the
level line is there to license or refuse. The same line rides every export
of the page, pedalscope-cli imd and the analysis dump, word for word.
Reading the product list
Each row is one invented tone: its recipe (2f1−f2 means twice the low note minus the high note), the pitch it lands on, its level below the notes you played (dBc — 0 dBc would be as loud as the louder note), and how far it stands above this capture’s own measurement floor. Rows within a few cents of a real pitch are the lucky ones; the rest fall between the frets. A level is the analysis bin’s own magnitude, exactly: both notes sit on exact bins, so every product does too, and the analyzer reads that one bin and no neighbour. (Until 3 September 2026 it took the loudest of the bin and its two neighbours “to tolerate drift” there was none of — which left a strong product untouched and read every bin at the noise about 4 dB high. Records captured before that date carry the old reads; the floor those records quote was measured the same way, so their margins stand.)
Under each card of a record page the sentences that explain a reading sit behind Notes on this reading (closed until you open it, and remembered per card); the line above the triangle always carries the verdict — a coherence check over the bar, a tile that is a lower bound, where a trace goes dashed — and an exported picture prints every note in full.
The floor is measured, and it belongs to this capture
The level below which a rig cannot tell a product from noise is not a fixed number (the two floors a record quotes, and why the one under the table can never change a product’s verdict, are set out on How Chord IMD is analyzed). It depends on the interface, the gain staging, the pedal’s own hiss and the drive you measured at — so PedalScope measures it from the same capture the products came from, and states it under the table.
The evidence is already in the spectrum. The analyzer tests every product bin against the median of its own spectral neighbourhood — the bins within about ±9 Hz of it, leaving out every bin that holds a played note, another product or DC, so on any lattice the “noise around it” is noise and not the pedal’s other products — and the bins that hold nothing standing above that neighbourhood are direct reads of this rig’s noise at those frequencies. (The neighbourhood is a span in hertz on purpose: a noise floor is local in frequency, and a fixed number of bins would have shrunk sixteenfold when the record length grew.) Their median is the capture’s floor — and only bins the instrument can actually read count: a bin it refuses on lattice position (A recipe beside a played note, below) or on frequency (Below the band, below) is left out of the floor exactly as it is left out of the table, so the floor is never computed partly from bins the page has just declared unreadable. A quieter rig resolves deeper products; a noisier one resolves fewer, and the line under the table says which you have. (Where a picture is exported the same floor is drawn as a dashed rule on the spectrum, so a reader who cannot click still sees how deep the capture could see.)
Four answers, not two
Every product gets one of four readings, and “absent”, “cannot resolve” and “below the band” never print the same way:
Resolved — the bin stands above the noise around it. The row is ranked, with its true level and its margin over the floor.
Nothing above the floor — the bin holds no content standing above its own noise. The honest statement is a bound (“nothing here above −106.9 dBc”), never a value and never a rank; several such tones agreeing to a tenth of a dB would be the floor talking, not the pedal, so they collapse into one faint line.
Could not be read — the question could not be answered at all. That happens when the capture offered too few empty bins to say how deep it saw, when the analysis window overran the stimulus’s fade-out and the deepest products cannot be separated from the window’s own leakage, or when a recipe lands within a few analysis bins of one of the played notes (see A recipe beside a played note below). A rig too noisy to answer a question deserves to be told so, rather than handed a clean-looking table of zeros.
Below the band — the recipe lands under the 20 Hz edge of the band the percentages integrate. On the current record length one does: 3f1−2f2, about 1 Hz up. Nothing a pedal does at 1 Hz can be told from the capture’s own drift, offset and settling — on the reference bench that bin read 24 dB above the floor with a reference stage in the loop and at the floor on a bare cable, and at 1 Hz the instrument has no way to say which of those the pedal made — so the product is named in its own line, its stem draws dotted, and it is counted neither present nor absent. The band’s upper edge has no such rule: a product above 20 kHz is inaudible but perfectly attributable, and reads like any other.
That second case no longer arises in a new measurement. The analysis window is sized to the two-tone signal it is reading — or rather the signal is sized to the window: the two tones play for as long as the analysis needs plus a short settle at each end, so the window lands wholly inside the steady part of the tones at every rate PedalScope offers, 44.1, 48, 88.2 and 96 kHz alike. Since 3 September 2026 that window is about 22 seconds (a record length of 2²¹ samples at 96 kHz, 2²⁰ at 48 kHz — the same stretch of time), against 1.4 seconds before, and the measurement takes about 26 seconds. The length is what buys the lattice spacing the next section is about. Records captured before that date were analyzed over their own 1.4 s window and still are; nothing stored changed.
Earlier versions used one number for both jobs — the level the chart’s axis stops at doubled as the decision floor — so genuine products below it were dismissed with a confident sentence. On the project’s own reference stages that was half of what a diode pair actually produces: its deepest genuine product sits at −102.9 dBc, 7.7 dB clear of that capture’s measured floor of −110.6 dBc. Nothing stored changed; every existing record simply reads correctly now.
Second-order products also carry a built-in cross-check. They come in pairs a single quadratic term produces together — f1+f2 with f2−f1, and 2f1 with 2f2 (corrected for the tone balance) — so a product standing more than a few dB above what its partner licenses is not a clean second-order reading: something else lives in that bin — low rumble or hum, or a noise ridge. Such a product draws faint, with the excess quoted in a note under the table — the energy is real, but its recipe label and its rank are not to be trusted.
A separate mark covers the probe’s own arithmetic. Both tones sit on exact analysis bins, so every product lands on a bin exactly — and on a tone ratio that reduces to small numbers, more than one recipe lands on the same bin. Records measured on such a probe (the original A2+E3 default snapped to an exact 3:2, where the third-order 2f2−f1 fell exactly on 2f1) mark those rows as shared bins: the level is real energy, but the recipe and order labels are the enumeration’s tie-break, not measurements, and the second-order cross-check says nothing about them. New measurements never carry the mark — the interval probe now clears these collisions before playing a note (see Modes below).
A recipe beside a played note
Clearing the collisions is not the same as keeping products apart. On the record length PedalScope used until 3 September 2026 (2¹⁷ samples, 1.4 s), a fifth’s tone bins were 150 and 226, and four even-order recipes (−2f1+2f2 and 4f1−2f2 beside the low note, 3f1−f2 and −3f1+3f2 beside the high one) landed two analysis bins from the played notes; a fifth recipe, −3f1+2f2, landed two bins from DC. Two bins is inside a played note’s own skirt: a bin there can hold the note’s leakage, or a slow wobble of the note, as easily as anything the pedal made, and the instrument cannot tell which. On the reference bench a bare cable read those four bins at −50 dBc on one capture and at the floor on another the same afternoon; a diode clipper put genuine products in them.
So on those records those recipes are not read at all. Their stems draw dotted, their rows sit in the could not be read line naming the lattice, and the tiles that would have summed them read as lower bounds (“≥”) — the line under the tiles names every recipe left out, where it sits (“2 bins below f2”), and which tiles lost it. On the fifth all four are chord tones, so Thickening and All products carry the mark and the other roles lost nothing. Nothing is claimed about the excluded recipes in either direction: not present, not absent, not looked at. The DC one gets its own could not be read line (“2 bins above DC”); it sits at grid zero of the interval and under the 20 Hz edge the sums integrate, so it was never in any tile and marks no bound. It is a reading rule applied to every record by its own lattice; the stored capture-time figures are untouched.
On the current record length the rule has nothing to mark. The longer window makes the bins fine enough that the tone pair can be placed on a lattice whose products sit at least 22 bins from either note and from DC (the lattice-spacing story is in Modes, below), so the four recipes beside the notes are read as products. The nearest recipe to DC, 3f1−2f2, now lands about 1 Hz up — outside the neighbourhood this rule guards, and under the band’s 20 Hz edge, where the Below the band reading above takes over: the same refusal for a different reason, and the two are never worded as one. Simulation Mode’s interactive preview still uses the short window and still carries the marks; a saved simulation snapshot uses the full length and does not.
A recipe beside a louder product
The same rule, one step further along the lattice. On a record whose lattice puts products only a few bins apart (the probe used until 3 September 2026: g = 2, so recipes cluster two bins apart), a product within 12 bins of a louder product that stands above its own local floor cannot be read either: at that separation the bin holds the louder product’s skirt. The louder of the pair is read; the quieter is refused, its stem draws dotted, the could not be read line names the neighbour, and the tiles that would have summed it read as lower bounds. On the current record length nothing is ever closer than 22 bins, so this rule marks nothing there.
When the loudest product is louder than the notes (a rectifier puts f2−f1 forty-odd dB above them), the coherence check under the table cannot be read — every bin beside the notes is that product’s — and then nothing can be claimed about whether the notes stayed still. A product more than the skirt depth below the loudest one (1/(π·g) at the lattice spacing: 36.8 dB at 22 bins, computed from the record’s own lattice) is marked unread, never present, and one sentence on the record says so. When the check holds, a product sits on its own bin with no skirt and even a quiet neighbour one lattice step away is read.
The bins beside the notes are the coherence check
The analyzer relies on both played notes staying exactly stationary against its analysis window for the whole capture — that is what lets every product land on a bin and leak nowhere (the premise, and what a rectangular window costs when it fails, are on How Chord IMD is analyzed; this section is the line on the page). If anything in the chain drifts during the capture — the interface’s clock, a sagging supply, a circuit warming up — the leakage lands first and hardest in the bins immediately beside each note. So a line under the product table reads those bins as a coherence check.
On records captured on the current record length the check reads the raw spectrum at the nine bins either side of each note. Nothing a pedal makes can land there: every product of a two-tone lattice sits at a multiple of the lattice’s spacing (22 bins on the default fifth), so those bins hold only what the notes themselves spilled. The worst of them is compared with the noise floor measured right beside that note, and the excess is read against a bar of 30 dB — measured, not chosen, from three loop-only captures on the reference bench: the one that lost coherence read 53 dB over its floor, the two clean captures the next morning 10 dB. Over the bar the line says so plainly, draws in orange, and the measure sheet announces it the moment the number exists, on every path that captures: a single measurement in its result preview; a family run under the next prompt — while you are stopped and can still abort cleanly — naming the cell, and again in the finished panel with one line per cell that exceeded (to re-capture just that cell’s Chord IMD afterwards, delete the record and Resume the sweep: the cell reads pending again and only the missing measurement is taken); a Full Fingerprint suite as soon as its Chord IMD member completes, kept up through the finished panel where you look after an unattended walk. What it says: the played notes did not stay stationary across the window, so the whole spectrum is smeared and this capture’s floor and product levels are not trustworthy — whatever was in the loop. The reading cannot name the source and does not try; a pedal with a dying battery can move a note over twenty seconds as surely as a rig can. Under the bar it says the premise held. One more condition, and it is a level, not a distance: those bins can only be read while the played notes are louder than anything the pedal makes — under lost coherence every component spills a skirt, and a product louder than the notes would put its own skirt in the bins beside them. So the check first compares the record’s loudest product with a ceiling for each offset (the nearer the bin to the note, the more it tolerates) and reads only the offsets that clear it, naming which; a pedal whose products stand above its own fundamentals — a full-wave rectifier, say — is not read at all, and the line says why instead of a verdict. Beside the excess the line states what noise alone would put over the floor for the number of bins it read, so a reading over four bins and one over thirty-six can be laid side by side. The line also quotes the sideband pair about each note and their difference: a shared frequency wander puts the pair about the high note 20·log₁₀(f2/f1) above the pair about the low one (3.5 dB on the default fifth), while an amplitude or a frequency-independent phase modulation leaves the two pairs equal — a shape to look at, never a verdict. Nothing is refused: a capture over the bar is still saved as measured, so you can decide what to do with it.
Records captured on the earlier, shorter record length carry no such reading. For them the check reads the four refused recipes two bins from each note (the section above) against the capture’s own floor, and there a pedal’s own products share those bins, so only a loop-only null run is interpreted — the 2 September 2026 null run that lost coherence reads 53 dB over its floor there and is marked not trustworthy — while a pedal record’s number is shown and labelled not attributable: neither a pass nor a failure, and never a statement about the pedal. Records captured before the interval probe was fixed have no product beside a note and show no line.
Modes
Musical interval (the differentiator): pick two notes — a power chord’s fifth, a major third — and see exactly what your pedal makes of them. Measure the same pedal on E2+B2 and then E3+G♯3 and the “thirds sound bad through dirt” folklore turns into visible, labeled spikes. Both tones snap to exact analysis bins, and the snap is done in two steps. First the interval is fixed: the pair of bin numbers is written as a common factor times a reduced ratio (2398 : 3586 is 22 × 109 : 163), and the ratio alone decides the interval that is played, whatever the sample rate or record length. PedalScope chooses that ratio once, against every sample rate it offers at the same time: no two products may share a bin, every product must sit at least 13 bins from the played notes at every rate, both tones must stay within ±15 cents of what you asked for — and among the ratios that manage all three, the one whose interval is closest to the one you asked for. The default fifth lands on 109 : 163, a fifth 3.4 cents flat of equal temperament, the same at 44.1, 48, 88.2 and 96 kHz. Then the common factor is whatever multiple fits this rate’s bin grid: 22 at 96 and 48 kHz, 24 at 88.2 and 44.1. The header quotes the exact pitches delivered (“A2 −4¢ · E3 −7¢”), so every product keeps its own bin and its label stays a fact, and two records of one pedal at different rates ask the same musical question (what those cents offsets mean against a real guitar is on Tuning and temperament). (An earlier version searched for the widest product spacing within the pitch budget and let the interval drift 48 cents between sample rates; the ratio-first search replaced it on 3 September 2026.) On a record too short to place the chosen ratio — Simulation Mode’s interactive preview — the snap falls back to the widest collision-free lattice inside the budget, and the recipes that crowd the notes there are marked unreadable rather than measured (A recipe beside a played note, above): consonance is a simple ratio, and a simple ratio is a crowded lattice, which is a fact about the probe and not a defect. An interval that cannot escape an exact small ratio inside the budget at all is refused before anything plays, and the refusal names the best lattice it found and the ratio that fails.
The two lab-standard probes are not offered. Guitar-adapted SMPTE (110 Hz + 1.3 kHz at 4:1) and CCIF twin-tone (two close, equal tones) modes existed in the code before 1.0 and were retired on 5 September 2026: a standard is never nudged onto a clean bin lattice, so neither could be given the separation the interval probe has — SMPTE’s 1320 Hz is exactly the twelfth harmonic of 110 Hz, so its recipes coincide by the protocol’s own arithmetic on a fine enough record, and the twin tone’s lattice put products one bin apart. A measurement that could not keep its product labels honest was not worth shipping. If comparing against a published datasheet ever calls for one, a standards-mode probe returns in a later version with its lattice facts stated. The “Growl (SMPTE)” and “Sourness (CCIF)” names some older screenshots show were the retired tile labels (see above), not these modes.
What’s musically meaningful
Fifths are forgiving because their IM products land on or near the harmonic series the two notes already share — the project’s reference hard clipper, fed a power chord, put its strongest product almost exactly on the just major third above the root: extra thickness, not dissonance. Thirds and sevenths scatter products between the frets. That’s the physics behind arrangement wisdom every guitarist absorbs: power chords for the gain channel, triads for the clean one. How much a pedal punishes intervals — its IMD level at matched drive — is a real, comparable character trait: “chewy vs. fizzy” made measurable.
Hear it
The Hear-it panel is the whole argument in four buttons, loudness-matched: the clean interval, the distorted interval, the products only — every invented tone isolated from the notes and their harmonics — and distorted minus products, the same distortion with the mush surgically removed. Play a major third and toggle: the products-only lane is the clatter you could never quite point at; the minus-products lane is how polite the same pedal would be if physics allowed it. The panel states its interval (“A2 + E3 — from this record”) and a picker swaps it for any §2.3 musical interval on the same root — thirds mush, fifths mostly don’t, and now you can hear exactly that through the same measured model (the audio re-renders on change). The footer states the toggle’s measured contrast for this record’s model — a number below the stated contrast floor (a bar on that measured metric, not a hearing threshold) means the comparison is subtle on this device, not a playback fault. Headphones or full-range monitors recommended — see Listening conditions.
Listen for: Under the two notes there's a rough, beating undergrowth that neither note explains — that's the intermodulation, about to be isolated below.
Listen for: Only the undergrowth remains: a dissonant, clattering chord of tones the pedal invented. Through a clean bypass this lane is near-silence — the products are made by the distortion, not the notes.
Common misreadings
IMD is not THD. Two pedals with identical single-note harmonic recipes can treat chords differently. Don’t extrapolate chord behavior from the Harmonic Distortion; this measurement exists because you can’t.
dBc is relative. Products are quoted below the played notes’ level; a −40 dBc product at bedroom volume and at stage volume are the same measurement. What changes product levels is drive, so compare at matched drive levels.
A resolved product is not necessarily the pedal’s. The measurement says a tone stands above this capture’s noise, not what made it. A bare loopback with no pedal in it still resolves a handful of products — the interface’s own converters intermodulate — so a control capture (Null run) is what separates the rig’s contribution from the device’s. The floor cannot do that job and does not claim to.
Near-pitch products aren’t harmless — a product 8 cents off the major third still beats against fretted notes. “Lands on a pitch” is better than “lands between frets”, not a free pass.
Try it on a record: open a Chord IMD measurement.