Harmonic Distortion
The recipe. Distortion is addition: a pedal takes the note you play and adds new notes above it — its harmonics. Which harmonics, how loudly, and how that changes across the neck is the pedal’s sound. This chart is that recipe, measured.
Two words, two levels: the Fingerprint is a pedal’s full characterization — the whole suite of measurements made at one setting (this one, plus Transfer Curve, Compression, Gain Map, and Chord IMD). Harmonic Distortion — this chart — is one lens on it. In the library, a Fingerprint groups its sub-measurements under the pedal.
What it shows
Each curve is one harmonic — a note the pedal adds above the one you play. Read a curve at the note you play: the H3 value at A3 (220 Hz) is how loudly the pedal outputs that note’s third harmonic, at 660 Hz. Odd harmonics (aqua) sound gritty and edgy; even harmonics (orange) sound warm and octave-like. H1 is the pedal’s basic tone shaping — its EQ. “Relative to H1” re-reads everything against that EQ so you see the pure harmonic mix.
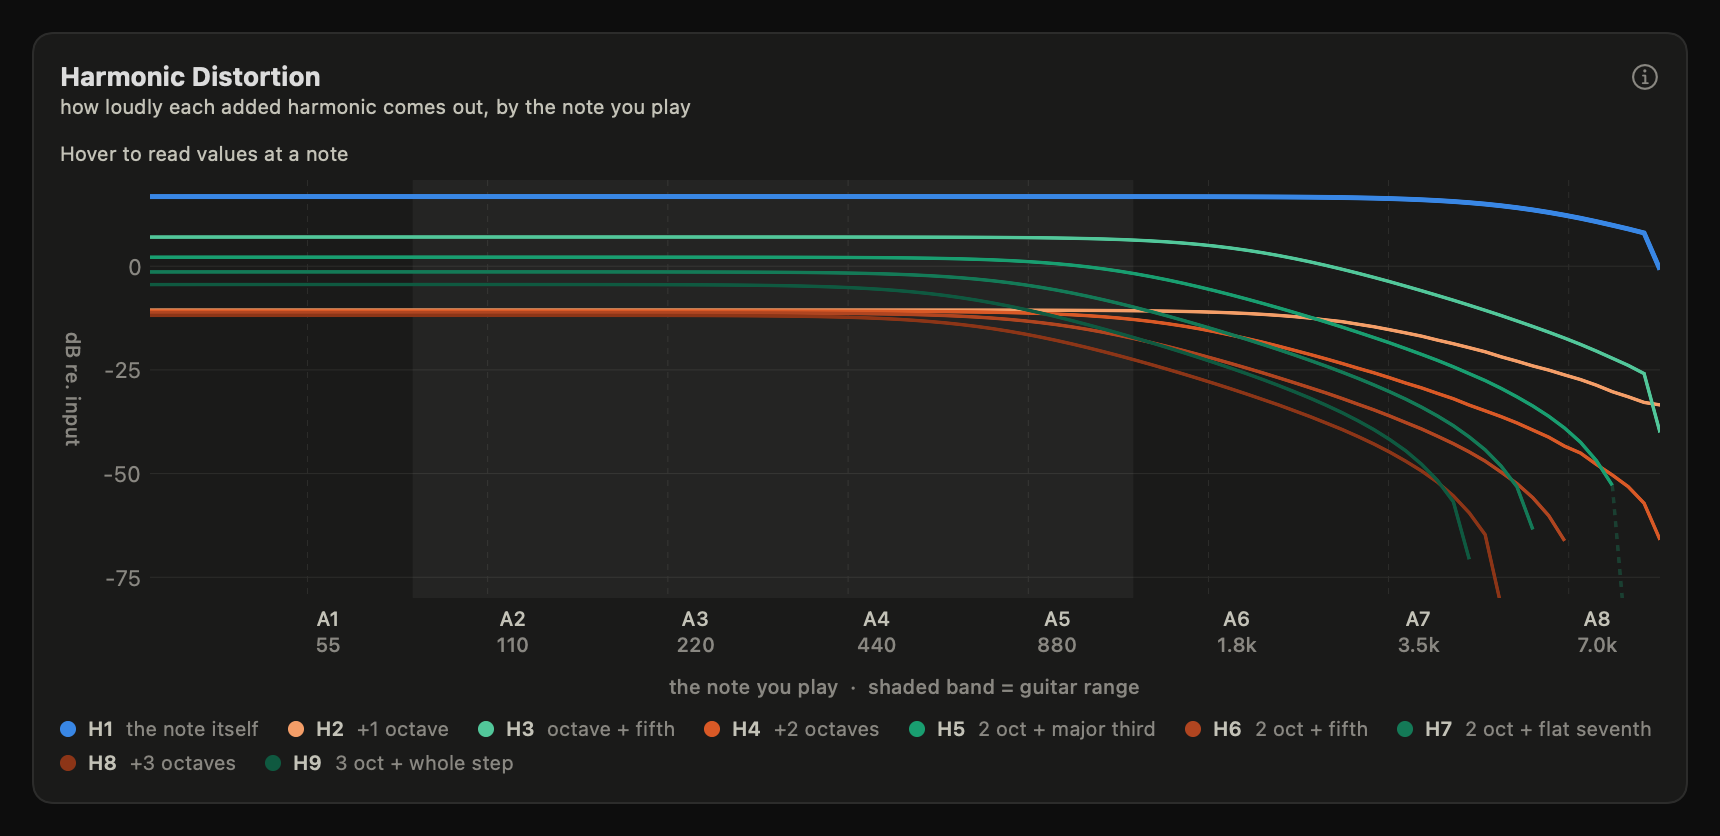
The legend spells out what each harmonic is musically: H2 is one octave up, H3 an octave and a fifth, H4 two octaves, H5 adds a major third — which is why the odd/even balance isn’t audio trivia but chord voicing.
How to read it
Hover to read exact values at any note; the shaded band marks guitar range.
The axis is yours to frame. Every frequency chart carries two small selectors (top right of the plot). Range windows the axis: Full is the whole measured band, Audio is 20 Hz–20 kHz, and Guitar is 70 Hz–8 kHz — low E with drop-tuning headroom, up to where guitar-speaker cabs have rolled off; where the instrument actually lives. Audio and Guitar are fixed frames — the axis shows exactly that band no matter what was measured, so every record is framed identically (a measurement that stops short of the band’s edge simply leaves that margin empty). Unit labels the ticks as note names (with Hz beneath) or as Hz alone. Both apply app-wide to every frequency chart and are remembered.
Grit vs. warmth at a glance: if the aqua (odd) family dominates, the clipping is symmetric — focused, classic hard-clip character. A strong orange (even) H2 means asymmetry — thicker, warmer, octave-tinged. Don’t take the chart’s word for it: in Simulation mode the asymmetry slider is that H2 — at zero the even stems sit on the floor, and every notch you add raises them out of it, audibly.
Slope of the family matters. Harmonics that die off quickly with order (H7, H9 far below H3) sound smooth; a slowly decaying series reads as bright, fizzy, aggressive.
The falling right side of every curve is usually the pedal’s tone filter shaving harmonics off — the same filter you hear as its treble character.
A faded, dashed tail means “past the reliable edge”, not “quiet”. Reading harmonic k at note f₀ means reading output frequency k·f₀, and for high harmonics of high notes that lands beyond the band the measurement chain can honestly report. The trace continues faded there so the geometry is visible, but the values are analysis artifacts, not the pedal — nothing downstream (fits, summaries, comparisons) uses them. Hover marks these readings with
*.
Distortion vs. note (the THD chart)
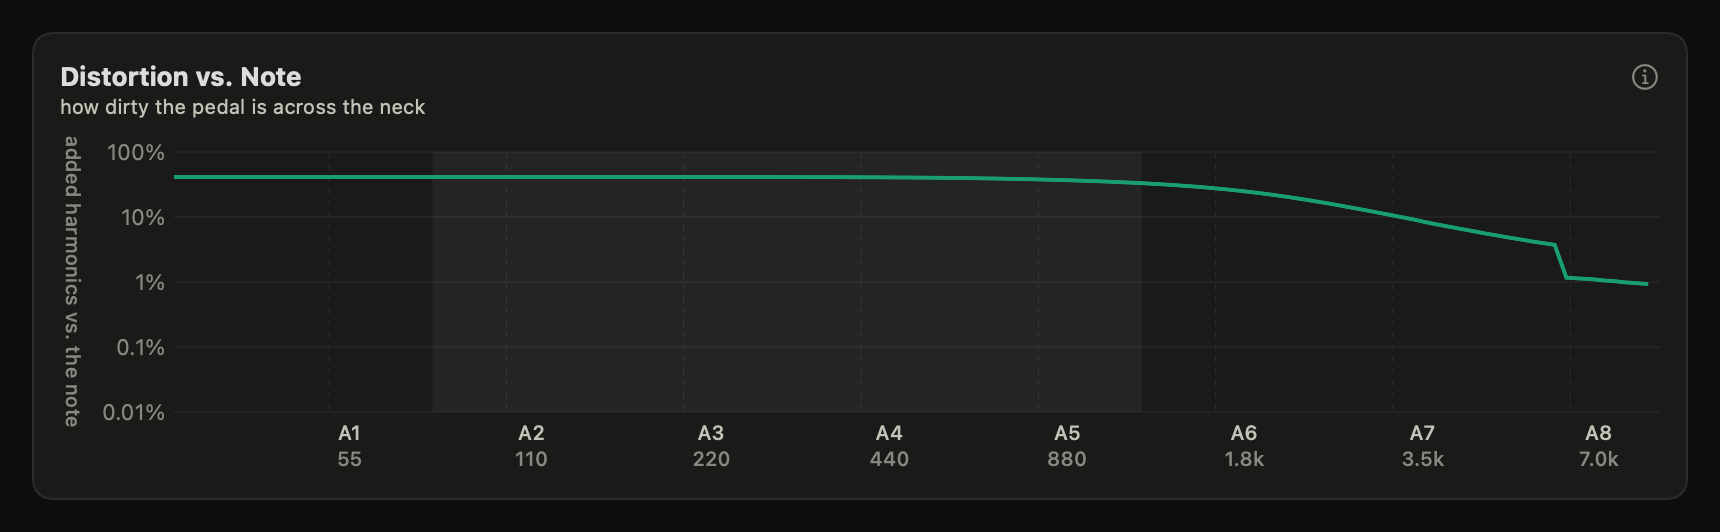
Total harmonic distortion: how much of the output is added harmonics rather than the note you played. Around 1% is audible hair, 10% is obvious drive, 40%+ is fuzz territory. A falling curve toward high notes usually means a tone filter is shaving the harmonics off. The figure counts harmonics in the audible band (20 Hz–20 kHz) — what a rig could reproduce and an ear could hear — so the same pedal quotes the same THD at any capture rate.
Hear it
Recipe resynthesis plays the chart: the fundamental plus the measured H2…H9 levels, rebuilt as pure tones. Solo the groups — full recipe, odd only, even plus fundamental, fundamental alone — and the bars become timbre: the odd family alone is the grit, the even family alone is the octave-flavored warmth, and the full recipe is the pedal’s steady-state color. Every variant is loudness-matched, so what changes is character, never volume. Headphones or full-range monitors recommended — see Listening conditions.
▶ Drag the asymmetry slider yourself — watch H2, then hear it
Common misreadings
One Harmonic Distortion measurement is one drive level. “This pedal has more H2 than that one” is only meaningful at matched levels — loudness bias is real in measurements too. The Gain Map makes level a full axis.
H1 isn’t distortion. It’s the pedal’s linear tone shaping (EQ). A mid-hump in H1 colors the sound even at clean settings — toggle “Relative to H1” to separate EQ from harmonic content.
Harmonics above the pedal’s tone filter aren’t “missing” — they’re filtered. Read the fingerprint together with H1 before crediting a circuit with politeness its output cap is providing.
For the curious
The measurement is Farina’s synchronized swept-sine method with Novák’s
phase synchronization: an exponential sweep makes each harmonic of the
sweep arrive as a time-shifted copy in the deconvolved response, so one
sweep separates H1…H9 cleanly. Each H_k(f) is normalized by input
amplitude and read on the output frequency axis (the k-th harmonic of
fundamental f₀ is read at k·f₀); a unit-gain wire measures H1 = 1. THD is
√(Σ|H_k|²)/|H1| for k ≥ 2, integrating the audible band (20 Hz–20 kHz)
regardless of capture rate. The interface’s own response and floor are
measured in calibration and divided out.
Two distinct limits bound every read, and the app keeps them separate. Validity: a read at k·f₀ is trustworthy only up to the band the chain was calibrated over (division by the loopback response is meaningless past the calibration sweep’s own edge) and below the point where the capture’s alias image of the next harmonic order collides with it, at f₀ = fs/(2k+1) — both derived per record from the recorded sweep and calibration parameters. Beyond that bound traces fade and every downstream consumer excludes the points. Policy: among trustworthy reads, musician-facing figures count only the audible band — ultrasonic harmonics are real, and the full captured band still feeds the Hear-it model, but they aren’t sound a rig delivers, so they don’t shift the quoted numbers.
Try it on a record: open a Harmonic Distortion measurement, or watch the recipe move while you turn knobs in Live mode.